Tuesday, March 18, 2014
Create a Standby Database using EM12c
I wanted to make this a quick post, because a friend was mentioning a slight problem during a manual set up of Data Guard. I told him you could do it through EM, and then recalled that I had documented it a while back. After the tube light finally went on in my head, it occurred to me that this would a good post.
When leveraging EM to set up, monitor, and manage (Active) Data Guard, Data Guard Broker is configured by default. A quote from Oracle Docs:
"Oracle Data Guard ensures high availability, data protection, and disaster recovery for enterprise data. Data Guard provides a comprehensive set of services that create, maintain, manage, and monitor one or more standby databases to enable production Oracle databases to survive disasters and data corruptions. Data Guard maintains these standby databases as transactionally consistent copies of the primary database. If the primary database becomes unavailable because of a planned or an unplanned outage, Data Guard can switch any standby database to the production role, thus minimizing the downtime associated with the outage. Data Guard can be used with traditional backup, recovery, and cluster techniques, as well as the Flashback Database feature to provide a high level of data protection and data availability.”
Whether or not you chose to set up a different network/listener for the Data Guard traffic is entirely your choice (and a good one in my opinion). However, in this scenario, I simply used the default parameters to illustrate a point.
1. Navigate to the particular database’s home page.


2.On the database home page, click on “Avaliability”->”Add Standby Database”.

3. On the next screen, click the first radio button and “Continue”. We will create a new “Physical Standby” database.
I will explore this section further after Data Guard is setup.

4. We can leverage the Duplicate from Active Database feature in 11g, therefore, leave default values and click “Continue”.
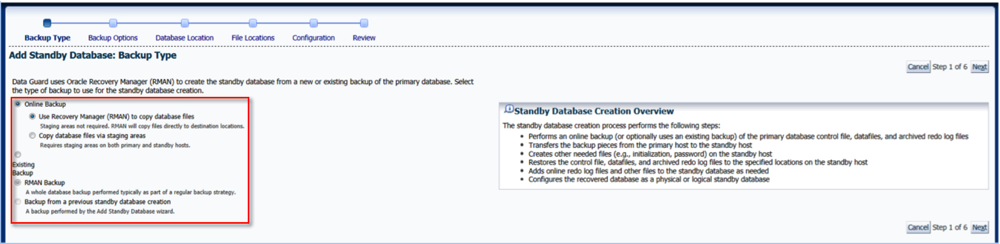
5. Either create a new credential set or use an existing one.
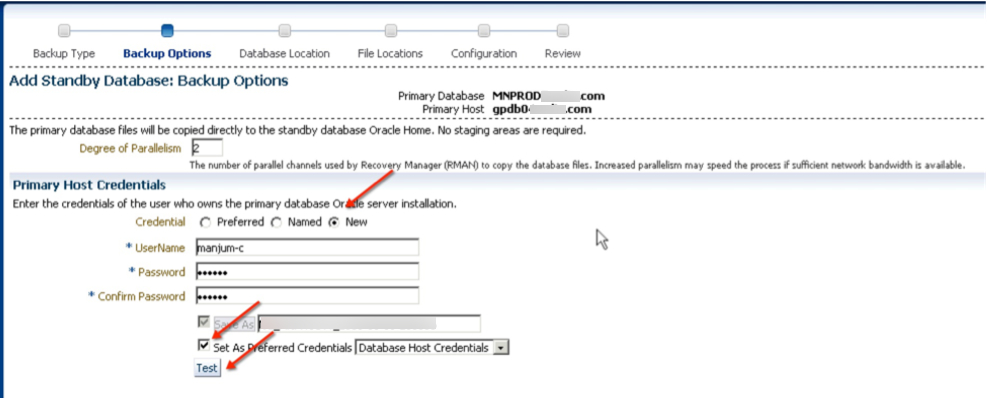
6. Next, we select which host the standby instance will be created on.

7. At this point, we can chose the relevant file locations. You have the option to change them compared to the primary database if needed.
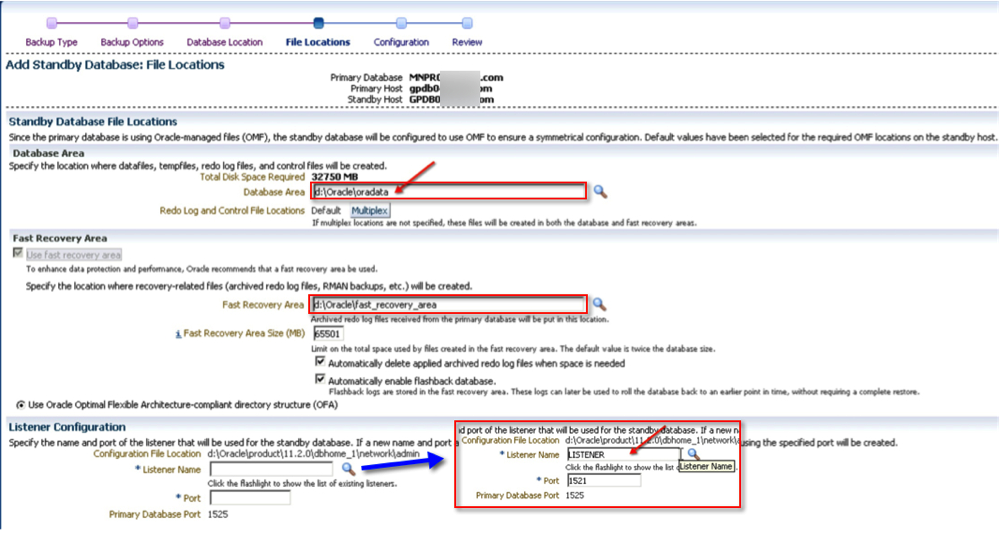
8. Time to give the new guy a name. You could optionally decide to monitor it as well (a good idea in my opinion). Should you also want to use a different connect net services identifier other than what EM uses, now is a good time to do that.

9. Finally, review your settings and click “Finish”.

10. As with most “tasks” in EM, a job is submitted which can be reviewed.

10.1 Job details.

One complete, the new standby database is configured and ready! In addition to EM, you can also verify the status via Data Guard Brokers interface. By the way, the output below is from a different system.
[oracle@server01 ~]$ dgmgrl /
DGMGRL for Linux: Version 11.2.0.3.0 - 64bit Production

Copyright (c) 2000, 2009, Oracle. All rights reserved.

Welcome to DGMGRL, type "help" for information.
Connected.
DGMGRL> show configuration

Configuration - prim_db.global.name

  Protection Mode: MaxPerformance
  Databases:
    prim_db   - Primary database
    stand_db - Physical standby database

Fast-Start Failover: DISABLED

Configuration Status:
SUCCESS

DGMGRL>
The funny thing about Data Guard, at least from my experience, is that there’s no two same configurations. For some reason or the other, usually related to network configuration, or one-off requirements which cause the difference. If you follow the steps above, then at the very least you will have a standardized way to deploy standby databases.
Hope this helps!
Cheers.
Tuesday, March 11, 2014
opatch apply online on 11.2.0.4
The credit for the patch apply in the post goes to a new friend that wishes to remain anonymous, except that her initials start with KA, and who happens to work at a company in Memphis, TN. Coincidentally, that is where I had been liv. During a recent EM12c project at her company, we were going through the steps to create a 2-node RAC environment. After registering it with Enterprise Manager, and adding the relevant targets (Oracle Homes, Databases, Listeners etc) we tested the connectivity (specifically checking the tablespace usage) to one of the databases and receive an “ORA-01000 maximum open cursors” message.
The open_cursors parameter in the respective database was set to 5000, and there were hardly any connections on it at the time which could explain it. We attempted a local login (from the respective host) as well as a listener based login, both of which were successful. After a quick search on MOS, it turns out there’s a bug which causes queries from Enterprise Manager on 11.2.0.4 Databases: “EM 12c: Querying a List of tablespaces for an 11.2 Oracle Database Results in ORA-1000 Error in Enterprise Manager 12.1.0.3 Cloud Control (Doc ID 1618684.1)”. The solution, according to the MOS note, was to apply Patch 17897511 on the RDBMS home where the 11.2.0.4 instance resides.
Since I’d never tested the online patching process, it seemed like a good time to try it out. I’d recommend reading Jason Arniel’s post here on the subtle “ism’s” of online patching - I found it to be quite useful.
Let’s begin.
d-oratest11-db01.planets.com:/u01/oracle/software/patch/17897511:oratst111> /u01/oracle/product/11.2.0/db_1/OPatch/opatch apply online -connectString oratst111:sys:password:d-oratest11-db01,oratst112:sys:password:d-oratest11-db02
Oracle Interim Patch Installer version 11.2.0.3.4
Copyright (c) 2012, Oracle Corporation.  All rights reserved.


Oracle Home       : /u01/oracle/product/11.2.0/db_1
Central Inventory : /u01/oracle/oraInventory
   from           : /u01/oracle/product/11.2.0/db_1/oraInst.loc
OPatch version    : 11.2.0.3.4
OUI version       : 11.2.0.4.0
Log file location : /u01/oracle/product/11.2.0/db_1/cfgtoollogs/opatch/17897511_Feb_14_2014_12_28_57/apply2014-02-14_12-28-56PM_1.log


The patch should be applied/rolled back in '-all_nodes' mode only.
Converting the RAC mode to '-all_nodes' mode.
Applying interim patch '17897511' to OH '/u01/oracle/product/11.2.0/db_1'
Verifying environment and performing prerequisite checks...
All checks passed.
Backing up files...

Patching component oracle.rdbms, 11.2.0.4.0...
Installing and enabling the online patch 'bug17897511.pch', on database 'oratst111'.


Verifying the update...

Patching in all-node mode.

Updating nodes 'd-oratest11-db02'
   Apply-related files are:
     FP = "/u01/oracle/product/11.2.0/db_1/.patch_storage/17897511_Jan_28_2014_07_45_26/rac/copy_files.txt"
     DP = "/u01/oracle/product/11.2.0/db_1/.patch_storage/17897511_Jan_28_2014_07_45_26/rac/copy_dirs.txt"
     MP = "/u01/oracle/product/11.2.0/db_1/.patch_storage/17897511_Jan_28_2014_07_45_26/rac/make_cmds.txt"
     RC = "/u01/oracle/product/11.2.0/db_1/.patch_storage/17897511_Jan_28_2014_07_45_26/rac/remote_cmds.txt"

Instantiating the file "/u01/oracle/product/11.2.0/db_1/.patch_storage/17897511_Jan_28_2014_07_45_26/rac/copy_files.txt.instantiated" by replacing $ORACLE_HOME in "/u01/oracle/product/11.2.0/db_1/.patch_storage/17897511_Jan_28_2014_07_45_26/rac/copy_files.txt" with actual path.
Propagating files to remote nodes...
Instantiating the file "/u01/oracle/product/11.2.0/db_1/.patch_storage/17897511_Jan_28_2014_07_45_26/rac/copy_dirs.txt.instantiated" by replacing $ORACLE_HOME in "/u01/oracle/product/11.2.0/db_1/.patch_storage/17897511_Jan_28_2014_07_45_26/rac/copy_dirs.txt" with actual path.
Propagating directories to remote nodes...
Installing and enabling the online patch 'bug17897511.pch', on database 'oratst112' on node 'd-oratest11-db02'.

Patch 17897511 successfully applied
Log file location: /u01/oracle/product/11.2.0/db_1/cfgtoollogs/opatch/17897511_Feb_14_2014_12_28_57/apply2014-02-14_12-28-56PM_1.log

OPatch succeeded.
Great! Let’s just make sure that it worked.
d-oratest11-db01.planets.com:/u01/oracle/software/patch/17897511:oratst111> /u01/oracle/product/11.2.0/db_1/OPatch/opatch lsinventory
Oracle Interim Patch Installer version 11.2.0.3.4
Copyright (c) 2012, Oracle Corporation.  All rights reserved.


Oracle Home       : /u01/oracle/product/11.2.0/db_1
Central Inventory : /u01/oracle/oraInventory
   from           : /u01/oracle/product/11.2.0/db_1/oraInst.loc
OPatch version    : 11.2.0.3.4
OUI version       : 11.2.0.4.0
Log file location : /u01/oracle/product/11.2.0/db_1/cfgtoollogs/opatch/opatch2014-02-14_12-29-37PM_1.log

Lsinventory Output file location : /u01/oracle/product/11.2.0/db_1/cfgtoollogs/opatch/lsinv/lsinventory2014-02-14_12-29-37PM.txt

--------------------------------------------------------------------------------
Installed Top-level Products (1):

Oracle Database 11g                                                  11.2.0.4.0
There are 1 products installed in this Oracle Home.


Interim patches (1) :

Patch (online) 17897511: applied on Fri Feb 14 12:29:01 CST 2014
Unique Patch ID:  17213015
   Created on 28 Jan 2014, 07:45:26 hrs PST8PDT
   Bugs fixed:
     17897511


Rac system comprising of multiple nodes
  Local node = d-oratest11-db01
  Remote node = d-oratest11-db02

--------------------------------------------------------------------------------

OPatch succeeded.
And, thats it. After the patch application, we were able to query the tablespace information for all databases running from this home successfully via Enterprise Manager.
Cheers!
Friday, February 7, 2014
Grid Infrastructure 12.1.0.1.0 Cluster Health Monitor - A Deconstruction
While digging around Grid Infrastructure logs, I came across this new feature with 12c called Cluster Health Monitor (CHM) - I knew the MGMTDB database was good for something when I opted to install it even though it is not required.
From Oracle’s Documentation
“The Cluster Health Monitor (CHM) detects and analyzes operating system and cluster resource-related degradation and failures. CHM stores real-time operating system metrics in the Oracle Grid Infrastructure Management Repository that you can use for later triage with the help of My Oracle Support should you have cluster issues."
Consisting of three components (see below), the CHM collects and stores data for later review on the cluster’s over-all health.
System Services Monitor (osysmond)
Where every node in the cluster contains this process, it is responsible for up-to-date monitoring and metric collection service at the Operating System level.
Cluster Logger Service (ologgerd)
This process is what actually retrieves data from the osysmond and writes it to the repository
Grid Infrastructure Management Respository
An Oracle instance which stores the collected data from osysmond. This will only run on a single (hub) node in a cluster, and by design will fail-over to another node should the one its on be unavailable. Interestingly enough, the data files for the instance are located on the same disk group as the OCR and Voting files. Oracle Docs do not talk about any specific sizing, but the onclumon utility is responsible for retention of the stored data.
Let’s take a look at all processes associated with a Grid Infrastructure setup.

[root@flex1 ~]# ps -ef | grep root | grep grid
root 2210 1 1 21:07 ? 00:00:57 /u01/app/12.1.0.1/grid/bin/ohasd.bin reboot
root 2516 1 0 21:07 ? 00:00:06 /u01/app/12.1.0.1/grid/bin/orarootagent.bin
root 2729 1 0 21:07 ? 00:00:02 /u01/app/12.1.0.1/grid/bin/cssdmonitor
root 2743 1 0 21:07 ? 00:00:02 /u01/app/12.1.0.1/grid/bin/cssdagent
root 4809 1 0 21:08 ? 00:00:20 /u01/app/12.1.0.1/grid/bin/octssd.bin reboot
root 5699 1 1 21:08 ? 00:01:04 /u01/app/12.1.0.1/grid/bin/osysmond.bin
root 5705 1 0 21:08 ? 00:00:39 /u01/app/12.1.0.1/grid/bin/crsd.bin reboot
root 5969 1 0 21:08 ? 00:00:22 /u01/app/12.1.0.1/grid/bin/orarootagent.bin
root 19405 1 0 22:10 ? 00:00:01 /u01/app/12.1.0.1/grid/bin/gnsd.bin -trace-level 1 -ip-address 192.168.78.244 -startup-endpoint ipc://GNS_flex1.muscle_5969_a598858b344350d1
root 20713 1 0 22:13 ? 00:00:01 /u01/app/12.1.0.1/grid/bin/ologgerd -M -d /u01/app/12.1.0.1/grid/crf/db/flex1
Diagnostics Collection
The most convenient method to query the data in the CHM Repository, is by executing the oclumon utility.
To collect diagnostic information, preferably all nodes in a cluster, you can run the diagcollection.pl script located in the $GRID_HOME/bin. There are options with this script to collected either all, or specific CRS daemon process logs.
[root@flex1 tmp]# /u01/app/12.1.0.1/grid/bin/diagcollection.pl --help
Production Copyright 2004, 2010, Oracle.  All rights reserved

Cluster Ready Services (CRS) diagnostic collection tool

diagcollection
    --collect
             [--crs] For collecting crs diagnostic information
             [--adr] For collecting diagnostic information for ADR; specify ADR location
             [--chmos] For collecting Cluster Health Monitor (OS) data
             [--acfs] Unix only. For collecting ACFS diagnostic information
             [--all] Default.For collecting all diagnostic information.
             [--core] UNIX only. Package core files with CRS data
             [--afterdate] UNIX only. Collects archives from the specified date. Specify in mm/dd/yyyy format
             [--aftertime] Supported with -adr option. Collects archives after the specified time. Specify in YYYYMMDDHHMISS24 format
             [--beforetime] Supported with -adr option. Collects archives before the specified date. Specify in YYYYMMDDHHMISS24 format
             [--crshome] Argument that specifies the CRS Home location
             [--incidenttime] Collects Cluster Health Monitor (OS) data from the specified time.  Specify in MM/DD/YYYYHH24:MM:SS format
                  If not specified, Cluster Health Monitor (OS) data generated in the past 24 hours are collected
             [--incidentduration] Collects Cluster Health Monitor (OS) data for the duration after the specified time.  Specify in HH:MM format.
                 If not specified, all Cluster Health Monitor (OS) data after incidenttime are collected
             NOTE:
             1. You can also do the following
                diagcollection.pl --collect --crs --crshome
     --clean        cleans up the diagnosability
                    information gathered by this script
     --coreanalyze  UNIX only. Extracts information from core files
                    and stores it in a text file
1. First off, we need to find out which node the OLOGGERD service is currently running.
[root@flex1 bin]# /u01/app/12.1.0.1/grid/bin/oclumon manage -get master

Master = flex1
2. Good, it happens to run on the same node I am currently on. Next, we can invoke the diagcollection.pl script to collect the data in the repository.
[root@flex1 tmp]# /u01/app/12.1.0.1/grid/bin/diagcollection.pl --collect
Production Copyright 2004, 2010, Oracle. All rights reserved
Cluster Ready Services (CRS) diagnostic collection tool
The following CRS diagnostic archives will be created in the local directory.
crsData_flex1_20140206_2335.tar.gz -> logs,traces and cores from CRS home. Note: core files will be packaged only with the --core option.
ocrData_flex1_20140206_2335.tar.gz -> ocrdump, ocrcheck etc
coreData_flex1_20140206_2335.tar.gz -> contents of CRS core files in text format

osData_flex1_20140206_2335.tar.gz -> logs from Operating System
Collecting crs data
/bin/tar: log/flex1/cssd/ocssd.log: file changed as we read it
Collecting OCR data
Collecting information from core files
No corefiles found
The following diagnostic archives will be created in the local directory.
acfsData_flex1_20140206_2335.tar.gz -> logs from acfs log.
Collecting acfs data
Collecting OS logs
Collecting sysconfig data
3. It generates a few tar balls, and a text file.
[root@flex1 tmp]# ls -lhtr
total 25M
-rw-r--r-- 1 root   root      25M Feb  6 23:36 crsData_flex1_20140206_2335.tar.gz
-rw-r--r-- 1 root   root      57K Feb  6 23:37 ocrData_flex1_20140206_2335.tar.gz
-rw-r--r-- 1 root   root      927 Feb  6 23:37 acfsData_flex1_20140206_2335.tar.gz
-rw-r--r-- 1 root   root     329K Feb  6 23:37 osData_flex1_20140206_2335.tar.gz
-rw-r--r-- 1 root   root      31K Feb  6 23:37 sysconfig_flex1_20140206_2335.txt
4. You could limit the data that collected by using date fields
[root@flex1 tmp]# /u01/app/12.1.0.1/grid/bin/diagcollection.pl --collect --afterdate 02/04/2014
5. I was curious, so I untar’d the crsData_flex1_20140206_2335.tar.gz file, and found that the logs from the following locations in the $GRID_HOME directory.
install/
log/flex1/
log/flex1/crfmond/
log/flex1/mdnsd/
log/flex1/gpnpd/
log/flex1/gipcd/
log/flex1/cvu/cvutrc/
log/flex1/cvu/cvulog/
log/flex1/racg/
log/flex1/crflogd/
log/flex1/cssd/
log/flex1/ohasd/
log/flex1/acfs/kernel/
log/flex1/ctssd/
log/flex1/gnsd/
log/flex1/crsd/
log/flex1/client/
log/flex1/agent/ohasd/oracssdmonitor_root/
log/flex1/agent/crsd/oraagent_oracle/
log/flex1/evmd/
cfgtoollogs/
cfgtoollogs/cfgfw/
cfgtoollogs/crsconfig/
cfgtoollogs/oui/
cfgtoollogs/mgmtca/
oc4j/j2ee/home/log/
oc4j/j2ee/home/log/wsmgmt/auditing/
oc4j/j2ee/home/log/wsmgmt/logging/
oc4j/j2ee/home/log/oc4j/
oc4j/j2ee/home/log/dbwlm/auditing/
oc4j/j2ee/home/log/dbwlm/logging/
OCLUMON
Now that we have dispensed with the logs, let’s see what this fancy OCLUMON can do.
1. First off, we need to set the logging level for the daemon we’d like to monitor.
[root@flex1 tmp]# /u01/app/12.1.0.1/grid/bin/oclumon debug log osysmond CRFMOND:3
2. Next, start the process with the dumpnodeview
[root@flex1 tmp]# /u01/app/12.1.0.1/grid/bin/oclumon dumpnodeview -n flex1

----------------------------------------

Node: flex1 Clock: '14-02-07 00.02.08' SerialNo:2081

----------------------------------------

SYSTEM:

#pcpus: 1 #vcpus: 1 cpuht: N chipname: Intel(R) cpu: 26.27 cpuq: 2 physmemfree: 141996 physmemtotal: 4055420 mcache: 2017648 swapfree: 3751724 swaptotal: 4063228 hugepagetotal: 0 hugepagefree: 0 hugepagesize: 2048 ior: 105 iow: 248 ios: 55 swpin: 0 swpout: 0 pgin: 105 pgout: 182 netr: 47.876 netw: 24.977 procs: 302 rtprocs: 12 #fds: 24800 #sysfdlimit: 6815744 #disks: 9 #nics: 3 nicErrors: 0

TOP CONSUMERS:

topcpu: 'apx_vktm_+apx1(7240) 3.40' topprivmem: 'java(19943) 138464' topshm: 'ora_mman_sport(14493) 223920' topfd: 'ocssd.bin(2778) 341' topthread: 'console-kit-dae(1973) 64'


----------------------------------------

Node: flex1 Clock: '14-02-07 00.02.13' SerialNo:2082

----------------------------------------

SYSTEM:

#pcpus: 1 #vcpus: 1 cpuht: N chipname: Intel(R) cpu: 46.13 cpuq: 17 physmemfree: 110400 physmemtotal: 4055420 mcache: 2027560 swapfree: 3751708 swaptotal: 4063228 hugepagetotal: 0 hugepagefree: 0 hugepagesize: 2048 ior: 7714 iow: 210 ios: 399 swpin: 0 swpout: 6 pgin: 7212 pgout: 190 netr: 19.810 netw: 17.537 procs: 303 rtprocs: 12 #fds: 24960 #sysfdlimit: 6815744 #disks: 9 #nics: 3 nicErrors: 0


TOP CONSUMERS:

topcpu: 'apx_vktm_+apx1(7240) 3.00' topprivmem: 'java(19943) 138464' topshm: 'ora_mman_sport(14493) 223920' topfd: 'ocssd.bin(2778) 341' topthread: 'console-kit-dae(1973) 64'
This will regularly dump an output similar to a “top” command in linux. As with the diagcollection.pl script, there are date duration parameters for oclumon as well.
3. The data (in the MGMTDB instance) is stored in the CHM schema.
SQL> select table_name from dba_tables where owner = 'CHM';

TABLE_NAME
--------------------------------------------------------------------------------
CHMOS_SYSTEM_SAMPLE_INT_TBL
CHMOS_SYSTEM_CONFIG_INT_TBL
CHMOS_SYSTEM_PERIODIC_INT_TBL
CHMOS_SYSTEM_MGMTDB_CONFIG_TBL
CHMOS_CPU_INT_TBL
CHMOS_PROCESS_INT_TBL
CHMOS_DEVICE_INT_TBL
CHMOS_NIC_INT_TBL
CHMOS_FILESYSTEM_INT_TBL
CHMOS_ASM_CONFIG


10 rows selected.
4. As mentioned earlier, you can also manage the repository retention period from oclumon.
4.1 To find out the current settings, we can issue the -get parameter.
4.1.1 Find the repository size, in bytes.
[root@flex1 tmp]# /u01/app/12.1.0.1/grid/bin/oclumon manage -get repsize
CHM Repository Size = 136320
4.1.2 Find the repository data file location
[root@flex1 tmp]# /u01/app/12.1.0.1/grid/bin/oclumon manage -get reppath

CHM Repository Path = +DATA/_MGMTDB/DATAFILE/sysmgmtdata.260.835192031
4.1.3 Find the master and logger nodes
[root@flex1 tmp]# /u01/app/12.1.0.1/grid/bin/oclumon manage -get master

Master = flex1
[root@flex1 tmp]# /u01/app/12.1.0.1/grid/bin/oclumon manage -get alllogger

Loggers = flex1,
[root@flex1 tmp]# /u01/app/12.1.0.1/grid/bin/oclumon manage -get mylogger

Logger = flex1
4.2 To set parameters, follow some of the examples below.
4.2.1 The changeretentiontime is merely an indicator for how much longer the underlying tablespace can accommodate the collected data. The value is (I believe) in seconds.
[root@flex1 tmp]# /u01/app/12.1.0.1/grid/bin/oclumon manage -repos changeretentiontime 1000
The Cluster Health Monitor repository can support the desired retention for 2 hosts
4.2.2 Change the repository’s tablespace size (in MB). This also changes the retention period.
[root@flex1 tmp]# /u01/app/12.1.0.1/grid/bin/oclumon manage -repos changerepossize 6000
The Cluster Health Monitor repository was successfully resized.The new retention is 399240 seconds.
The alert.log for -MGMTDB shows a simple ALTER TABLESPACE command.
Fri Feb 07 00:28:11 2014
ALTER TABLESPACE SYSMGMTDATA RESIZE 6000 M
Completed: ALTER TABLESPACE SYSMGMTDATA RESIZE 6000 M
The size of the instance has obviously increased as well.
[root@flex1 tmp]# /u01/app/12.1.0.1/grid/bin/oclumon manage -get repsize
CHM Repository Size = 399240
5. And last, but not least, the version check!
[root@flex1 tmp]# /u01/app/12.1.0.1/grid/bin/oclumon version

Cluster Health Monitor (OS), Version 12.1.0.1.0 - Production Copyright 2007, 2013 Oracle. All rights reserved.
Well, I hope this has been an insightful post on the new CHM feature in the 12c release of Grid Infrastructure. If anything, the diagcollection.pl will be a nice replacement to the RDA that Support might request. I haven’t had to troubleshoot any clusteware issues on 12c, but I plan to break this environment and use the oclumon utility to debug the processes at a later date.
Cheers!
Wednesday, December 18, 2013
Patch and Provision with EM12c: Index
Over the last few months, I’ve written a few posts on Provisioning Databases in EM12c. After writing them out, I’ve realized that they’re note organized in the best manner. With that in mind, I’ve created a list (see below) which I hope to keep updated, and you will find as a helpful resource.
1. Patch and Provision with EM12c: #1 Database Provisioning - Provision Me a Database!
2. Patch and Provision with EM12c: #2 Database Provisioning - Profiles
3. Patch and Provision with EM12c: #3 Database Provisioning - Using Profiles
4. Patch and Provision with EM12c: #4 Software Library - Create a Component From Oracle Home Clone
Upon further view, I found I wasn’t quite done with this list as I have written other blogs to support the above ones.
1. Adding Entities (Component) to the Software Library in Oracle Enterprise Manager 12.1.0.3.0
Cheers!
Friday, November 1, 2013
11gR1 to 11gR2 RAC - An Upgrade Experience on Solaris
As of late, I’ve started documenting the life out of any project/task, and this is one of in the long line of many.
Basically, the goal here was to upgrade an existing 11gR1 RAC configuration to 11gR2 RAC. To supplement the pretty picture, the following tasks were involved:

- Upgrade 11gR1 CRS+ASM to 11gR2 Grid Infrastructure
- Upgrade 11gR1 RDBMS to 11gR2 RDBMS
- Upgrade 11gR2 Instances to 11gR2
Thanks to my friend Osama Mustafa (@osamaoracle) for reviewing it!! I would cherish any comments, or feedback from my readers with their experiences.
Cheers
Wednesday, October 30, 2013
SRVCTL: Add Preferred Instances
Tuesday, October 15, 2013
How to Resume an RMAN Duplicate on Failure - Just Re-Run it!
RMAN-03002: failure of recover command at 10/07/2013 15:11:47
RMAN-06054: media recovery requesting unknown archived log for thread 1 with sequence 53302 and starting SCN of 143193979270
RUN
{
        ALLOCATE auxiliary CHANNEL CH01 TYPE 'SBT_TAPE' parms "ENV=(NB_ORA_POLICY=ORACLE_RAC01_PRD1_FULL,NB_ORA_CLIENT=RAC01,NB_ORA_SCHED=Default-Application-Backup)";
        ALLOCATE auxiliary CHANNEL CH02 TYPE 'SBT_TAPE' parms "ENV=(NB_ORA_POLICY=ORACLE_RAC01_PRD1_FULL,NB_ORA_CLIENT=RAC01,NB_ORA_SCHED=Default-Application-Backup)";
        ALLOCATE auxiliary CHANNEL CH03 TYPE 'SBT_TAPE' parms "ENV=(NB_ORA_POLICY=ORACLE_RAC01_PRD1_FULL,NB_ORA_CLIENT=RAC01,NB_ORA_SCHED=Default-Application-Backup)";
        ALLOCATE auxiliary CHANNEL CH04 TYPE 'SBT_TAPE' parms "ENV=(NB_ORA_POLICY=ORACLE_RAC01_PRD1_FULL,NB_ORA_CLIENT=RAC01,NB_ORA_SCHED=Default-Application-Backup)";
        ALLOCATE auxiliary CHANNEL CH05 TYPE 'SBT_TAPE' parms "ENV=(NB_ORA_POLICY=ORACLE_RAC01_PRD1_FULL,NB_ORA_CLIENT=RAC01,NB_ORA_SCHED=Default-Application-Backup)";
        ALLOCATE auxiliary CHANNEL CH06 TYPE 'SBT_TAPE' parms "ENV=(NB_ORA_POLICY=ORACLE_RAC01_PRD1_FULL,NB_ORA_CLIENT=RAC01,NB_ORA_SCHED=Default-Application-Backup)";

        SET NEWNAME FOR DATAFILE 54 TO '/u03/oradata/RPTPRD/data_01.365.668441285';
        SET NEWNAME FOR DATAFILE 54 TO '/u03/oradata/RPTPRD/data_01.365.668441285';
        . . .
        . . .
        SET NEWNAME FOR DATAFILE 54 TO '/u03/oradata/RPTPRD/data_01.365.668441285';

        DUPLICATE TARGET DATABASE TO RPTPRD
                UNTIL SCN 143197743846
                LOGFILE GROUP 1 ('/r01/oradata/RPTPRD/redo01a.log',
                                '/r02/oradata/RPTPRD/redo01b.log') SIZE 500M REUSE,
                        GROUP 2 ('/r01/oradata/RPTPRD/redo02a.log',
                                '/r02/oradata/RPTPRD/redo02b.log') SIZE 500M REUSE,
                        GROUP 3 ('/r01/oradata/RPTPRD/redo03a.log',
                                '/r02/oradata/RPTPRD/redo03b.log') SIZE 500M REUSE
                NOFILENAMECHECK
                SPFILE
                PARAMETER_VALUE_CONVERT 'PRD','RPTPRD'
                SET CONTROL_FILES='/u01/oradata/RPTPRD/control01.ctl','/u02/oradata/RPTPRD/control02.ctl','/u03/oradata/RPTPRD/control03.ctl'
                SET DB_CREATE_FILE_DEST='/u03/oradata/RPTPRD'
                SET AUDIT_FILE_DEST='/u01/app/oracle/admin/RPTPRD/adump'
                SET DB_RECOVERY_FILE_DEST='/a01/flash_recovery_area'
                set DIAGNOSTIC_DEST='/u01/app/oracle/'
                SET DB_RECOVERY_FILE_DEST_SIZE='20G'
                SET local_listener='(address=(protocol=TCP)(host=apvmrdb01)(port=1529))'
                SET FAL_CLIENT=''
                SET FAL_SERVER=''
                SET log_archive_dest_2=''
                SET dg_broker_start='FALSE'
                SET CLUSTER_DATABASE='FALSE'
                SET log_archive_dest_1='LOCATION=/a01/flash_recovery_area'
                SET db_create_online_log_dest_2='/r02/oradata/RPTPRD'
                SET db_create_online_log_dest_1='/r01/oradata/RPTPRD'
                SET standby_archive_dest='';
}
Starting recover at 07-OCT-13

starting media recovery

unable to find archived log
archived log thread=1 sequence=53302
Oracle Error:
ORA-01547: warning: RECOVER succeeded but OPEN RESETLOGS would get error below
ORA-01194: file 1 needs more recovery to be consistent
ORA-01110: data file 1: '/u03/oradata/RPTPRD/system.326.665261191'

released channel: CH01
released channel: CH02
released channel: CH03
released channel: CH04
released channel: CH05
released channel: CH06
RMAN-00571: ===========================================================
RMAN-00569: =============== ERROR MESSAGE STACK FOLLOWS ===============
RMAN-00571: ===========================================================
RMAN-03002: failure of recover command at 10/07/2013 15:11:47
RMAN-06054: media recovery requesting unknown archived log for thread 1 with sequence 53302 and starting SCN of 143193979270
contents of Memory Script:
{
   set until scn  143197743846;
   recover
   clone database
    delete archivelog
   ;
}
executing Memory Script

executing command: SET until clause

Starting recover at 07-OCT-13

starting media recovery

channel CH01: starting archived log restore to default destination
channel CH01: restoring archived log
archived log thread=1 sequence=53302
channel CH01: reading from backup piece al_180608_1_828139086
channel CH02: starting archived log restore to default destination
channel CH02: restoring archived log
archived log thread=2 sequence=46813
channel CH02: restoring archived log
archived log thread=1 sequence=53303
channel CH02: reading from backup piece al_180607_1_828139086
channel CH03: starting archived log restore to default destination
channel CH03: restoring archived log
archived log thread=2 sequence=46814
channel CH03: restoring archived log
archived log thread=2 sequence=46815
channel CH03: reading from backup piece al_180609_1_828139086
channel CH04: starting archived log restore to default destination
channel CH04: restoring archived log
archived log thread=1 sequence=53304
channel CH04: reading from backup piece al_180612_1_828145845
channel CH05: starting archived log restore to default destination
channel CH05: restoring archived log
archived log thread=2 sequence=46816
channel CH05: reading from backup piece al_180611_1_828145845
channel CH06: starting archived log restore to default destination
channel CH06: restoring archived log
archived log thread=1 sequence=53305
channel CH06: reading from backup piece al_180614_1_828153049
channel CH01: piece handle=al_180608_1_828139086 tag=TAG20131006T223805
channel CH01: restored backup piece 1
channel CH01: restore complete, elapsed time: 00:00:25
archived log file name=/a01/flash_recovery_area/1_53302_663959504.dbf thread=1 sequence=53302
channel CH01: starting archived log restore to default destination
channel CH01: restoring archived log
archived log thread=2 sequence=46817
channel CH01: reading from backup piece al_180616_1_828153049
channel CH03: piece handle=al_180609_1_828139086 tag=TAG20131006T223805
channel CH03: restored backup piece 1
channel CH03: restore complete, elapsed time: 00:00:25
channel CH02: piece handle=al_180607_1_828139086 tag=TAG20131006T223805
channel CH02: restored backup piece 1
channel CH02: restore complete, elapsed time: 00:00:40
archived log file name=/a01/flash_recovery_area/2_46813_663959504.dbf thread=2 sequence=0
channel clone_default: deleting archived log(s)
archived log file name=/a01/flash_recovery_area/2_46813_663959504.dbf RECID=7 STAMP=828199660
archived log file name=/a01/flash_recovery_area/2_46814_663959504.dbf thread=2 sequence=46814
channel clone_default: deleting archived log(s)
archived log file name=/a01/flash_recovery_area/2_46814_663959504.dbf RECID=4 STAMP=828199644
archived log file name=/a01/flash_recovery_area/2_46815_663959504.dbf thread=2 sequence=46815
channel clone_default: deleting archived log(s)
archived log file name=/a01/flash_recovery_area/1_53302_663959504.dbf RECID=3 STAMP=828199644
archived log file name=/a01/flash_recovery_area/1_53303_663959504.dbf thread=1 sequence=53303
channel clone_default: deleting archived log(s)
archived log file name=/a01/flash_recovery_area/1_53303_663959504.dbf RECID=2 STAMP=828199643
channel CH04: piece handle=al_180612_1_828145845 tag=TAG20131007T003044
channel CH04: restored backup piece 1
channel CH04: restore complete, elapsed time: 00:01:00
archived log file name=/a01/flash_recovery_area/1_53304_663959504.dbf thread=1 sequence=53304
channel clone_default: deleting archived log(s)
archived log file name=/a01/flash_recovery_area/2_46815_663959504.dbf RECID=1 STAMP=828199642
channel CH05: piece handle=al_180611_1_828145845 tag=TAG20131007T003044
channel CH05: restored backup piece 1
channel CH05: restore complete, elapsed time: 00:01:00
archived log file name=/a01/flash_recovery_area/2_46816_663959504.dbf thread=2 sequence=46816
channel clone_default: deleting archived log(s)
archived log file name=/a01/flash_recovery_area/1_53304_663959504.dbf RECID=5 STAMP=828199657
channel CH01: piece handle=al_180616_1_828153049 tag=TAG20131007T023048
channel CH01: restored backup piece 1
channel CH01: restore complete, elapsed time: 00:01:03
channel CH06: piece handle=al_180614_1_828153049 tag=TAG20131007T023048
channel CH06: restored backup piece 1
channel CH06: restore complete, elapsed time: 00:01:28
archived log file name=/a01/flash_recovery_area/1_53305_663959504.dbf thread=1 sequence=53305
channel clone_default: deleting archived log(s)
archived log file name=/a01/flash_recovery_area/2_46816_663959504.dbf RECID=6 STAMP=828199659
archived log file name=/a01/flash_recovery_area/2_46817_663959504.dbf thread=2 sequence=46817
channel clone_default: deleting archived log(s)
archived log file name=/a01/flash_recovery_area/1_53305_663959504.dbf RECID=8 STAMP=828199666
channel clone_default: deleting archived log(s)
archived log file name=/a01/flash_recovery_area/2_46817_663959504.dbf RECID=9 STAMP=828199670
media recovery complete, elapsed time: 00:00:08
Finished recover at 07-OCT-13
Thursday, September 26, 2013
How long did your Database Upgrade actually take?
Saturday, September 21, 2013
ORA-00119 During a Database Upgrade
- 11.1.0.7.0 CRS & ASM upgraded to 11.2.0.3.0 GI.
- 11.2.0.3.0 RDBMS Software Installed.
ORA000132: syntax error inresolved network name 'LISTENER_FREEDOM1'
ORA000132: syntax error inresolved network name 'LISTENER_FREEDOM2'
alter system set local_listener='(ADDRESS = (PROTOCOL = TCP)(HOST = xxxx-vip)(PORT = 1521))' scope=spfile sid='xxx2';
- Shutdown Database (from 11.1 RDBMS home)
- Startup Upgrade one instance on (from 11.2 RDBMS home)
- Upgrade Database Components
- Post Upgrade
