Wednesday, April 9, 2014
Metric Extensions in EM12c #1: Monitor a Useful Target such as a GoldenGate Instance
Back in August of 2013, I wrote a post on “Alternative Method to monitor GoldenGate from EM12c outside the GoldenGate 12.1.0.1.0 Plugin” and then back in December of 2013 I wrote another one a Metric Extension to Monitor Unsupported Database Versions. As it turns out, the first post has been quite useful in many customer sites but what it lacks is the process to actually build the Metric Extension (ME).
Note: If you are interested in more ways to monitor GoldenGate, be sure to check out my older posts, Bobby Curtis’ posts (1 & 2), and his upcoming presentation at Collaborate 14. Coincidentally, he is sitting with me on the plane ride over to #C14LV at the moment :-)
It’s important for me to share my experience and reason for not using the metrics provided with the EM12c GoldenGate plugin; I have found it to be a little inconsistent due to several reasons. Starting from the Berkley DB Datastore corruptions, to JAgent hangs, to inaccurate results on the GoldenGate homepage in EM12c, and lastly I’ve experienced unreliable alerting. The JAgent architecture was inherited from the GoldenGate Monitor days and can be roughly described by the illustration below (if this is inaccurate, I’d be more than happy to adjust the diagram below). The parts in green describe the components involved with collecting the data from the GoldenGate instance, as well as, the EM12c side. The process, at certain times, and on certain platforms (Windows) has broken from my experience and after working with Oracle Support for a while until the fixes were released with subsequent patches (11.2.1.0.X), but I still found the incident management and subsequent notifications to work unreliably.
The data flow, as illustrated below described the JAgent which connects to and stores information from the GG Objects periodically in its Datastore (dibdb directory). When the EMAgent polls for updates via the JMX port, it will do so by checking the datastore. Once the raw metric is collected within the repository, it is the EM12c incident management framework which triggers notifications.
With that being said, I’d like to pick up where I left off way back in August of last year.
I already have the output from the monitor_gg.pl script which I will invoke from my new Metric Extension. Let’s begin with a refresher on the lifecycle of an ME:
This post assumes that:
1. You have already downloaded the monitor_gg.pl script onto your host where Golden Gate instances are running.
2. You have tested the script from command line by invoking it, i.e. $ perl monitor_gg.pl and receive the output mentioned in my previous post.
Steps
1. Make your way to the Metric Extensions home page.
2. Click on “Create”, and enter the relevant details such as “Name”, and “Display Name”. Make sure you select the Adapter as “OS Command - Multiple Columns”. The rest you can leave at default values, or change as per your desired check frequency.
3. On the next page, enter the full path of the script in the “Command” section. Alternatively, you could also leave the “Command” section with the %perlBin%/perl and enter the absolute path of the script in the “Script” section.
4. On the next page, you need to specify the columns returned by the status check. The process is similar to what I mentioned in my previous post Metric Extension to Monitor Unsupported Database Versions, so I will quickly skim through the important bits.
It is important to note that I specified this and the following column as Key Columns. This is because the result set in the ME framework requires unique identifiers.
5. The next column represents the actual program name, i.e. Extract, Replicat, Manager etc.
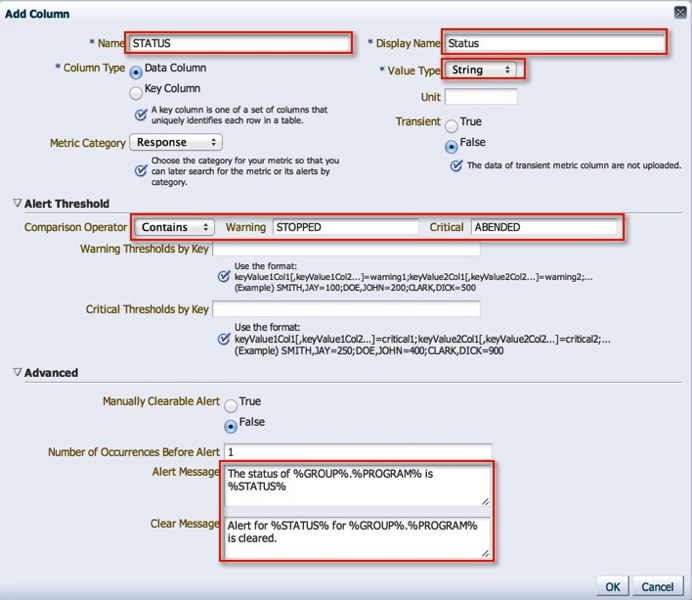
6. Status is an important column because we can use it to trigger state alerts. Note, that I have specified the Warning and Critical thresholds, alert and clear messages. Its quite cool how customizable the framework can be.
7. Next, we have the Lag at Checkpoint, a column which we will use for Alerting. Note, that I have specified the Warning and Critical thresholds, alert and clear messages.
7. Time Since Last Checkpoint is set up in the same manner as the previous column.
8. With that, we are done with the column configuration.
9. I leave the default monitoring credentials in place, however if you are running GoldenGate as user other than the “oracle” user, you will have to either a) create a new monitoring credential set or b) grant the oracle user execute on the monitoring script.
10. We’re coming to the end now. On the next screen, we can actually see this metric in action by running it against a target.
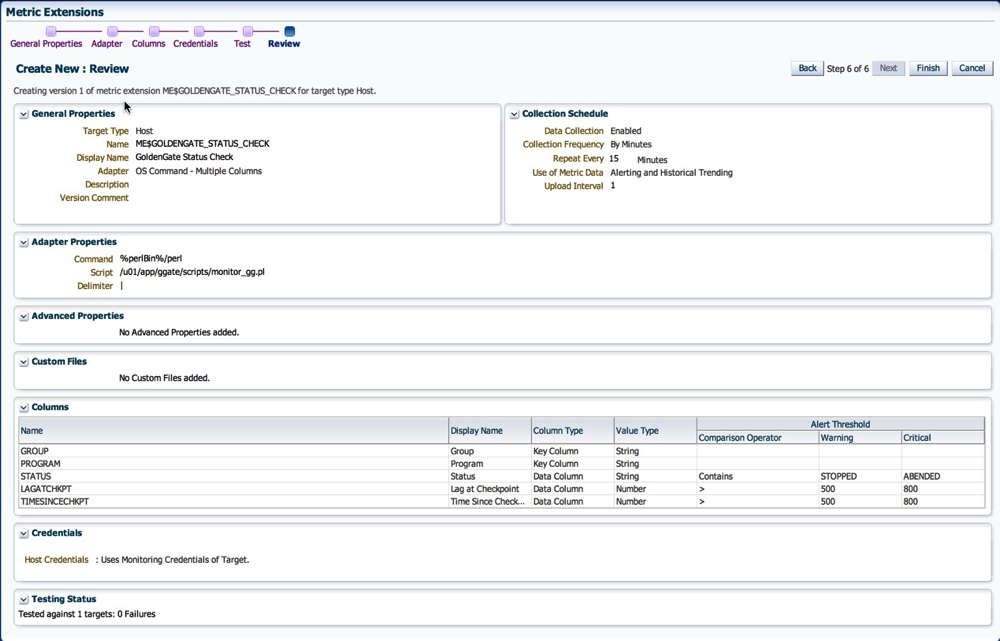
11. Next, we review our settings and save the Metric Extension.
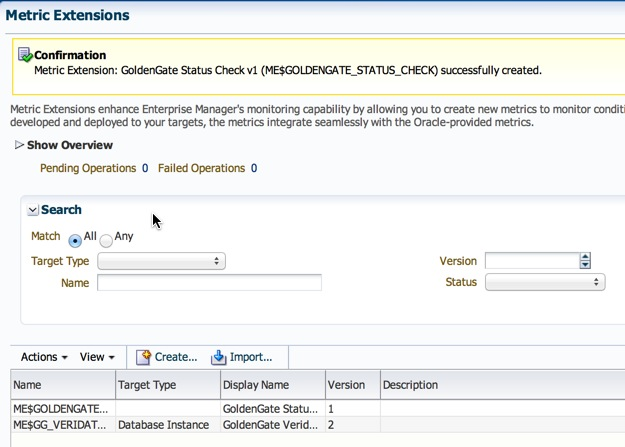
12. Now, back on the ME home page, the metric is in Editable Stage.
13. We simply need to save it as a “Deployable Draft” or a “Published” extension. The former state allows for deployments to individual targets, where as the latter is required for deployments to Monitoring Templates.
14. Follow steps listed under section 10 on my post on creation of metric extensions to deploy the ME.
Once deployed, the metric is collected at the intervals specified in step 2. Depending on how your incident rule sets are configured, you will most likely start receiving alerting once the thresholds we defined above are crossed.
I do have some lessons learned to add to the above posts from an Incident Management perspective, but that will have to be a completely different post :-)
Hope this helps.
Cheers!


Maaz:
ReplyDeleteThis is a Tour de force blog post on creating and deploying useful metric extensions for Oracle EM12c. Thank you for this contribution to the EM12c community!
Cheers! I feel the same way about Blue Medora's contributions to the EM12c community as well!
Delete