Monday, December 9, 2013
A Useful Metric Extension in EM12c for Unsupported Oracle Database Versions
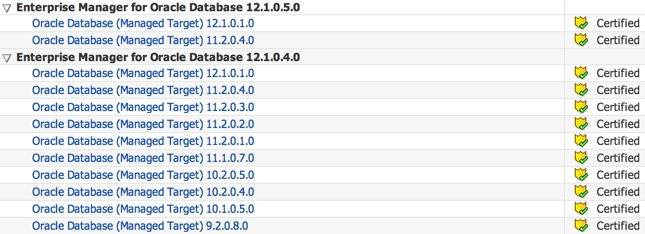
Metric Extensions (ME) in EM12c are the new User Defined Metrics from EM11g. It’s an awesome extension of EM12c to monitor non-standard metrics. For example, EM12c’s Oracle Database Plugin 12.1.0.4.0 and 12.1.0.5.0 are only supported with the following versions of the database:
I wrote a post on an Alternative Method to monitor GoldenGate from EM12c outside the GoldenGate 12.1.0.1.0 Plugin which is another good example.
What about the less-supported OS versions which fall in between? I had an unfortunate experience with a client post successful agent deployment where the console showed no explanation as to why the database targets (10.2.0.2, 10.2.0.3, 11.1.0.6 etc) remained in a “Status Pending” state. After an SR and many hours of wrestling with this issue, I was informed that the the particular releases were unsupported in EM12c due to inherent bugs within the databases’ alerting mechanism. The realization that the EM12c OMS spending time and resources (job queue processes) on a target in a “Status Pending” state would result in a waste resources and reduced allocation to monitor critical systems was valuable information. Even more valuable for any administrator who may first assume that a "Status Pending" target is a benign issue to address on a slow day. C’est la vie.
Moving right along, I knew there was a way to configure basic (Tablespace Usage and Database Status) monitoring for these poor databases and Metric Extensions were my solution. Please note, this solution worked only because the OS versions were supported for the agents. To summarize the illustration below, the extensions will be deployed onto the host target where the unsupported Oracle database version instances reside - along with support versions. This also means, that the new metric will at the host level because the unsupported database targets should not exist in the EM12c repository.
In this post, I’d like you show you how to setup a Tablespace Usage ME in EM12c. With a subsequent post, I will go over the Database Status check.
You might be wondering if there is more than one unsupported database version and the metric extension will be created on the host layer, then what would the data look like? Would it be one output with all databases, or different outputs for each respective database? Well, I gave that a lot of thought, and at the end of the day, what made me decide was “How will the metric be used?”. I needed alert notifications, so for that purpose a single output would suffice.
The basic lifecycle of a Metric Extension is illustrated on its Home Page in EM12c. Quite simply put, you develop, test, and eventually deploy the extension once ready. I’ll go through all of these steps for our unsupported versions towards the end the blog.
Let’s get started.
1. Before we can even begin with creating a Metric Extension, we need to design our “check”. In my case, it’s a simple query which is executed via shell script that loops through the /etc/oratab entries, and a) checks the status of the instance listed, b) if found active, then c) executes a SQL statement to collect the tablespace usage information. When I initially wrote this script, the host where I intended to run the ME only had unsupported versions of the Oracle Database running, therefore checking all instances in /etc/oratab made sense. If you have an environment where both types of databases (supported vs unsupported) reside, then perhaps a simple text file with the instances names, or make the script smarter to check for only unsupported releases (hard coded) from the oratab. I would appreciate any feedback with better suggestions!
The output for the above query would look similar to what you see below. Pay close attention to the order of the columns, this will be important later.
oracle on greed101 -# sh host_database_unsupported_version_tablespace.sh
RED|AIMTRANS|2200|1001|1199|45.51
RED|AKB_DATA|3247|1179|2068|36.3
RED|AUDIT_SUPPORT_TS|50|0|50|.25
RED|DGDATA1|700|272|428|38.87
RED|DGINDEX1|30|16|14|52.71
RED|SYSTEM|800|662|138|82.81
BLUE|EUL_DATA|100|16|84|16.5
BLUE|FACT1|600|329|271|54.85
BLUE|FACT2|226960|204288|22672|90.01
BLUE|INDEX1|300|179|121|59.75
BLUE|INDEX2|131616|118199|13417|89.81
BLUE|SYSTEM|800|662|138|82.81
GREEN|STRUCTURE1|1000|334|666|33.42
GREEN|SYSTEM|800|662|138|82.81
GREEN|WORK1|1052708|1001089|51619|95.1
GREEN|AUDIT_SUPPORT_TS|500|0|500|.01
BLACK|IVIS|500|235|265|46.94
BLACK|SYSTEM|300|189|111|63.12
BLACK|DATA_FEEDER_DATA|1200|733|467|61.06
BLACK|DGADATA1|8192|2312|5880|28.23
1. Navigate to the Metric Extensions home page in Enterprise Manager.
2. Click on Create.
3. Give the new Metric a name, display name, and a description. In Target Type, I left the default as “Host”. In Collection Schedule, I left the defaults as well. Click “Next”.

4. On the next screen, in the “Command” field, enter “sh” since we’ll be uploading a shell script. For the actual script, we need to click on the “Edit” pencil icon. Here, we can enter the file name and paste the actual script from above. The “Delimiter” field is quite important, because it is how the Metric Extension framework will differentiate the data between columns. Click “OK”.
Note 1: Alternatively, you could also upload the file if already saved on your local machine.
Note 2: You have to love the documentation provided towards the right half on this screen. The explanation is quite enough and interface is intuitive enough for you to figure out how to upload.
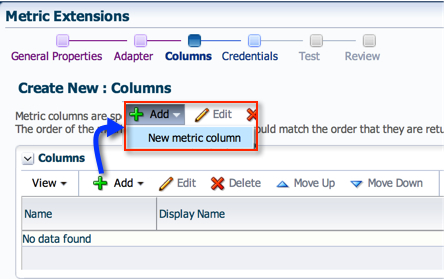
5. On the next screen, we will add columns to our metric. Do you recall the columns in the script from earlier? We need to now add them in the same order, i.e. Database Name, Tablespace Name, Total Space MB, Used Space MB, Free Space MB, and Used Space Percent.
5.1. The first is Database Name. A Metric Extension requires that at least one column contain unique values in the result set. For our result set, we will use the combination of Database Name, and Tablespace Name.
You must select the “Column Type” as “Key Column” and “Value Type" as “String”.
5.2. Tablespace Name, as mentioned earlier, is also a Key Column.
5.3. Total Space MB. Please note that I left the “Column Type” and "Value Type" as defaults.
5.4. Used Space MB. Please note that I left the “Column Type” and "Value Type" as defaults.
5.5. Free Space MB. Please note that I left the “Column Type” and "Value Type" as defaults.
5.6. Now, for the last and most important column. Used Space Percent.
Under “Metric Category” I selected “Capacity”. This setting doesn’t have an actual impact, but for reporting purposes is useful.
Since my ultimate goal was alerting for creating this metric, I picked the “Greater Than (>)” “Comparison Operator” and added Warning/Critical thresholds.
You can actually customize the alert message from this section using the columns added. I chose the message below, but please feel free to customize it to your desire.
Once all the information is entered, please click “OK” and then “Next”.
6. Use the default monitoring credential set.
7. Here we actually get to test out the script a host. Follow the screen shots below to run a test. Once test successfully, click “Next”.
8. Review your settings and click “Finish”.
Succes!
Remember this from earlier?
We have gone through the Development phase, and are ready to save this metric extension as a Deployable Draft.
9. On the Metric Extensions home page, select the extension we created -> Actions -> Save as Deployable Draft.
It’s status will now change to “Deployable Draft”
10. At this point, we have two options
a) Keep the metric extension in “Deployable Draft” status, and deploy directly onto a host target, or
b) Publish it, where it can be used by other modules within the EM12c infrastructure, i.e. my personal favorite, Monitoring Templates.
The latter allows us to have a more reliable and repeatable process by using Monitoring Templates. Its your lucky day, because I will show you how to do both.
10.1. Deploying a “Deployable Draft” Metric Extension to a target.
10.1.1. From the Metric Extension Home page, select the metric -> Actions -> Deploy to Target.
10.1.2. Add a target where you’d like to deploy the ME. Click “Submit” when done.
10.1.2. The next screen shows any pending operations. Waits a few seconds and hit refresh on the top right.
10.1.3. Back on the ME home page, we can actually see the # of targets the ME has been deployed onto.
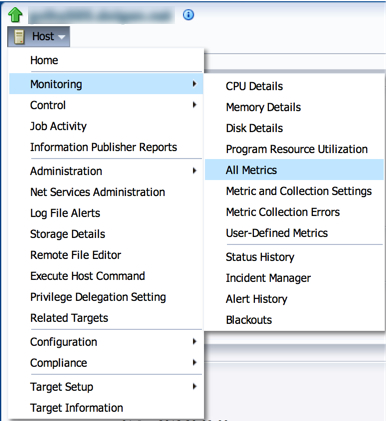
10.1.4. At this point, we can simply check on the Hosts “All Metrics” screen.
10.1.5. And presto, the metric and its data are collecting!
10.2. Deploying a Metric Extension to a Monitoring Template.
10.2.1. We need to ensure that the ME is in a “Published” state. To do that, select it from the ME home page -> Actions -> “Publish Metric Extension”
10.2.2. Now, make your way to the Monitoring Templates home page and either create a new one, or edit an existing one. The point here is to add metrics to the template.
10.2.3. On the Templates home page, click on “Create”.
10.2.4. On the next screen, select “Target Type” as the copy monitoring settings from option. Pick “Servers, Storage and Network” from the category, then “Host” from the Target Type.
You would alternatively, pick an existing host as the copy monitoring settings from, either way it doesn’t matter for our purpose. The template I create will only contain one metric.
10.2.5. Enter an appropriate name for the template, and a description. Then, click on the “Metric Thresholds” tab.
10.2.6. As I mentioned earlier, my goal is to create a template with only one metric. Therefore, I need to remove all the others. Click on the “Select All” button and then “Remove Metrics from Template”.
10.2.7. Click on “Add Metrics to Template”.
10.2.8. Select “Metric Extensions” in the search, and the results will show the ME created earlier. Select all columns from it and click “Continue” and “OK”.
Note: Change the thresholds if they need to be different in the template.
10.2.9. Next, we apply the template to a target. Select the template, and click on Apply. Add the targets you want to apply this template to and click “OK”.
10.2.10. Once applied, we can proceed to the hosts’ “All Metrics” page (Step 10.1.4.). And presto!
Now that we have the ME collecting data, you can create Incident Rules to catch the offending tablespaces. I won’t go into that with this post, but Kellyn Pot’vin has several awesome posts on Incident Management to address that aspect.
If you are still with me, I want urge you to let your imagination go wild with what all can be collected and monitored by leveraging EM12c’s Metric Extensions feature. Metrics from non-oracle databases, application specific information, and so on and so forth.
Cheers!


Wow -- what an incredibly detailed and useful blog about how to monitor older Oracle DB versions with Oracle EM specifically and how to design, build, and deploy Metric extensions specifically. Thank you for your contribution to the Oracle EM user community.
ReplyDeleteI'm happy that you enjoyed reading it! Thanks for the feedback :)
DeleteVery good explanation..
Delete