Monday, December 30, 2013
Create a Simple Job for a Host Target in EM12c
Afternoon folks! I received a text from a customer of mine asking whether I had any documentation to create jobs in EM12c. To be specific, the job in question could have been setup via crontab or windows jobs but since I had recommended consolidation of newer jobs in EM12c, this was a good question. The easiest route was to refer the customer to Oracle Documentation, but I have a few hours to kill and thought it would make a good post.
The job in question, is a veridata compare job. You could just as easily, replace that job with <insert script name here>. I’d like to show you how to set it up.
First, let’s make sure that our script actually works. For those who are not familiar with Veridata, it is Oracle’s solution to data comparison when replication is in use. The Veridata suite contains a Command Line Interface (CLI) called vericom that can be used to perform minimal activities on the jobs and compare pairs configured within it. I should have probably written another post on configuring jobs, but I’ll leave that for another day.
My innocent script is located in the $VERIDATA_HOME directory.
[oracle@as-sandbox-n1 scripts]$ pwd
/u01/app/oracle/product/11.2.1.0/veridata/scripts
[oracle@as-sandbox-n1 scripts]$ ls -lhtr
total 4.0K
-rwxrwxrwx 1 oracle oinstall 68 Nov  8 12:43 vericom_run_job.sh
[oracle@as-sandbox-n1 scripts]$ cat vericom_run_job.sh
/u01/app/oracle/product/11.2.1.0/veridata/vericom.sh -j BLUE_YELLOW
A sample execution of the script looks like:
VERIDATA_HOME /u01/app/oracle/product/11.2.1.0/veridata
JRE_HOME: /u01/app/oracle/product/11.2.1.0/veridata/jre
JAVA_OPTS: -Xmx1024m -Djava.awt.headless=true
Oracle GoldenGate Veridata Command Line Interface - Version 11.2.1.0  OGGVDT_11.2.1.0.0_PLATFORMS_121108.1625
Job BLUE_YELLOW started
Run ID: (1027,0,0)
Number of Compare Pairs: 3
Number of Compare Pairs With Errors: 3
Number of Compare Pairs With OOS: 0
Number of Compare Pairs With No OOS: 0
Number of Compare Pairs Cancelled: 0
Job Report Filename: /u01/app/oracle/product/11.2.1.0/veridata/shared/data/rpt/BLUE_YELLOW/00001027/BLUE_YELLOW.rpt
Run ID: (1027,0,0)
Job Completion Status: IN SYNC
That was the easy part :)
1. Now, let’s log into EM12c and navigate to the Jobs home page.
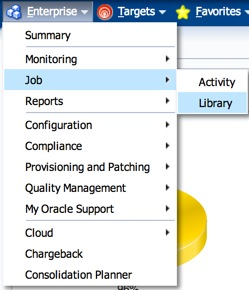
2. Since we need to create a job and the default option under “Create Library Job” is set to “OS Command”, click on Go.

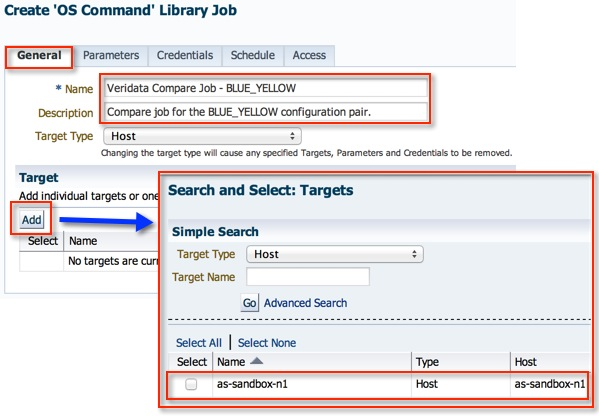
3. From here, you can give the job a name and description, and add a target where it will run.
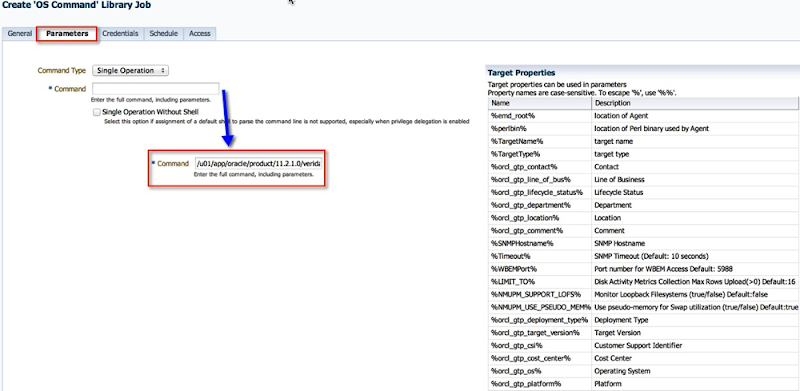
4. In the parameters tab, enter the absolute path of the script. You have the option of embedding the script within the job itself by choosing a different “Command Type”.
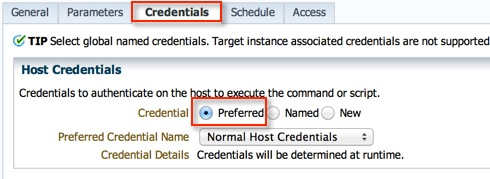
5. I already have a Preferred Named Credential Set configured for this host, so the defaults as left. Alternatively, you could pick one of the other two options as well, but it all depends on your configuration.
6. The insane schedule is merely to illustrate a point. You can pick your own.
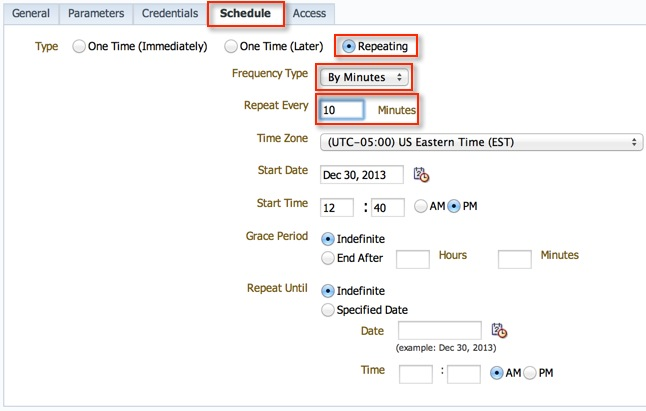
7. I generally do not make alterations to the Access tab, however, you may want to delegate ownership and access to other users. Click on “Save to Library”.

8. And that’s it!

9. I waited a few minutes before checking for the jobs activity.

10. Cool, the first one completed successfully. You can drill down to the log of the execution.
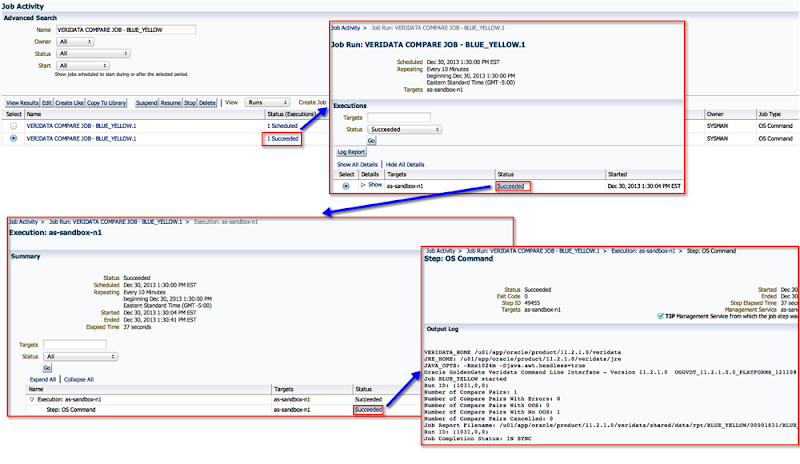
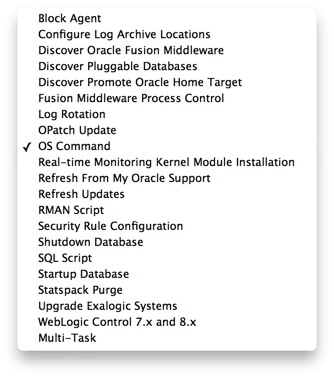
I’ve only scratched the surface of the job system in EM12c. There are several other options while creating jobs (see screenshot below). One of the most interesting for me are the multi-task jobs which I hope to write an article on eventually.
For the moment, I hope you enjoyed the article and found it useful.
Cheers!
Wednesday, December 18, 2013
Patch and Provision with EM12c: Index
Over the last few months, I’ve written a few posts on Provisioning Databases in EM12c. After writing them out, I’ve realized that they’re note organized in the best manner. With that in mind, I’ve created a list (see below) which I hope to keep updated, and you will find as a helpful resource.
1. Patch and Provision with EM12c: #1 Database Provisioning - Provision Me a Database!
2. Patch and Provision with EM12c: #2 Database Provisioning - Profiles
3. Patch and Provision with EM12c: #3 Database Provisioning - Using Profiles
4. Patch and Provision with EM12c: #4 Software Library - Create a Component From Oracle Home Clone
Upon further view, I found I wasn’t quite done with this list as I have written other blogs to support the above ones.
1. Adding Entities (Component) to the Software Library in Oracle Enterprise Manager 12.1.0.3.0
Cheers!
Saturday, December 14, 2013
OGG-01973 The redo record indicates data loss on object <OBJECT,ID>
Let’s walk through the setup, steps, and error message.
Configuration
A single Extract writing to trail files that are ready by a single Replicat - both on the same host but, with different source and target databases. The E_GG Extract captures transactions from 2 schemas from the SKY database and the replicat R_GG applies them on the target database (WATER).
Steps
1. Check GoldenGate process status
[oracle@blue ggate]$ ggsci

Oracle GoldenGate Command Interpreter for Oracle
Version 11.2.1.0.13 17435036 OGGCORE_11.2.1.0.0OGGBP_PLATFORMS_131002.1206_FBO
Linux, x64, 64bit (optimized), Oracle 11g on Oct 3 2013 02:39:46

Copyright (C) 1995, 2013, Oracle and/or its affiliates. All rights reserved.

GGSCI (blue.color) 1> info all

Program Status Group Lag at Chkpt Time Since Chkpt

MANAGER RUNNING
EXTRACT RUNNING E_GG 00:00:00 00:00:14
REPLICAT RUNNING R_GG 00:25:39 00:23:27
2. All looks good. Create a table on the source schema being replicated.
[oracle@blue ~]$ sqlplus day/oracle

SQL*Plus: Release 11.2.0.3.0 Production on Mon Dec 9 14:05:00 2013

Copyright (c) 1982, 2011, Oracle.  All rights reserved.

Connected to:

Oracle Database 11g Enterprise Edition Release 11.2.0.3.0 - 64bit Production

With the Partitioning, OLAP, Data Mining and Real Application Testing options

SQL> create table breakgg as select * from dba_tables;

Table created.
3. Check the Extracts status. ABENDED?
[oracle@blue ggate]$ ggsci

Oracle GoldenGate Command Interpreter for Oracle
Version 11.2.1.0.13 17435036 OGGCORE_11.2.1.0.0OGGBP_PLATFORMS_131002.1206_FBO
Linux, x64, 64bit (optimized), Oracle 11g on Oct 3 2013 02:42:32

Copyright (C) 1995, 2013, Oracle and/or its affiliates. All rights reserved.

GGSCI (blue.color) 1> info all

Program Status Group Lag at Chkpt Time Since Chkpt

MANAGER RUNNING
EXTRACT ABENDED E_GG 00:00:00 00:00:14
REPLICAT RUNNING R_GG 00:28:39 00:25:27
4. What does the report file tell us?
Source Context :
SourceModule : [er.redo.ora.sr]
SourceID : [/scratch/aime1/adestore/views/aime1_adc4150267/oggcore/OpenSys/src/app/er/redo/oracle/redoorasr.c]
SourceFunction : [get_subrec]
SourceLine : [6377]
ThreadBacktrace : [11] elements
: [/u01/app/ggate/libgglog.so(CMessageContext::AddThreadContext()+0x1e) [0x7ffdba940f3e]]
: [/u01/app/ggate/libgglog.so(CMessageFactory::CreateMessage(CSourceContext*, unsigned int, ...)+0x2cc) [0x7ffdba939c8c]]
: [/u01/app/ggate/libgglog.so(_MSG_ERR_ORACLE_REDO_DATA_LOSS(CSourceContext*, unsigned int, CMessageFactory::MessageDisposition)
+0x2f) [0x7ffdba9185f1]]
: [/u01/app/ggate/extract() [0x701d69]]
: [/u01/app/ggate/extract(REDOORASR_get_all_subrecs(int, objectpool*, unsigned char*, subrec_info_t*, redo_thread_t*, log_contex
t_t*)+0x6c) [0x701e8c]]
: [/u01/app/ggate/extract(REDO_read(char*, int*, long*, char*, short*, int, char*)+0x7e4) [0x6a4308]]
: [/u01/app/ggate/extract(READ_EXTRACT_RECORD(chkpt_context_t*, short, char*, __std_rec_hdr*, int*, int*, long*, short, short, c
har*, short*, char*, short*, long*, char*)+0x19b) [0x4f9bbb]]
: [/u01/app/ggate/extract(process_extract_loop()+0x625) [0x565975]]
: [/u01/app/ggate/extract(main+0x5e6) [0x578166]]
: [/lib64/libc.so.6(__libc_start_main+0xfd) [0x3d1e41ed1d]]
: [/u01/app/ggate/extract(__gxx_personality_v0+0x3a2) [0x4f18ba]]

2013-12-09 14:05:30 ERROR OGG-01973 The redo record indicates data loss on object 68,687.

***********************************************************************
* ** Run Time Statistics ** *
***********************************************************************


Report at 2013-12-09 14:05:30 (activity since 2013-12-09 13:41:25)

Output to ./dirdat/lt:


DDL replication statistics:

Operations: 0
Mapped operations: 0
Unmapped operations: 0
Other operations: 0
Excluded operations: 0


No records extracted.


2013-12-09 14:05:30 ERROR OGG-01668 PROCESS ABENDING.
5. OGG-01973? Well, this just raises too many questions. A quick search on MOS yields only a single note “OGG v11.2 Extract amends with “OGG-01965 The redo record indicates data loss on object <object id>” or "OGG-01973 The redo record indicates data loss on object <object id>" (Doc ID 1483431.1)". In it, there’s a note that the table can not be in NOLOGGING mode. But wait, this a new table and by default LOGGING is turned on.
6. What was I missing? I looked through the report file again, and found this message.
2013-12-09 13:41:25  WARNING OGG-01970  Database is not in archiving mode. Extract may be forced to fetch LONG columns and may miss transaction data if th

e online logs are recycled.

2013-12-09 13:41:25  WARNING OGG-01972  Extract will fetch all LONG columns because archiving mode is disabled.

2013-12-09 13:41:25  WARNING OGG-01423  No valid default archive log destination directory found for thread 1.
7. Ok, is archived logging turned on? Ouch, that is probably it!
SQL> archive log list

Database log mode      No Archive Mode

Automatic archival      Disabled

Archive destination      USE_DB_RECOVERY_FILE_DEST

Oldest online log sequence     52

Current log sequence      54
8. Okay, lets turn it on.
SQL> shutdown immediate

Database closed.

Database dismounted.

ORACLE instance shut down.

SQL> startup mount;

ORACLE instance started.


Total System Global Area  814227456 bytes

Fixed Size   2232760 bytes

Variable Size 297799240 bytes

Database Buffers 511705088 bytes

Redo Buffers   2490368 bytes

Database mounted.

SQL> alter database archivelog;

Database altered.

SQL> alter database open;

Database altered.
9. And try to create the table again. By the way, I was not able to skip the particular transaction in the Extract, and the only way around it (for the moment) was a rebuild of the extract and pump.
10. Once I did that, along with enabling archive log mode, DDL replication worked as expected!
In conclusion, follow the steps to pre-requisite checks to the letter i.e. database must have minimum supplemental logging enabled, check point table etc. Otherwise, you are simply inviting trouble! RTM my friends :) I hope you found this post helpful. I’ll have to spend more time to figure out how to skip a “bad” transaction in the Extract and blog about it at a later date.
Cheers!
Monday, December 9, 2013
A Useful Metric Extension in EM12c for Unsupported Oracle Database Versions
Metric Extensions (ME) in EM12c are the new User Defined Metrics from EM11g. It’s an awesome extension of EM12c to monitor non-standard metrics. For example, EM12c’s Oracle Database Plugin 12.1.0.4.0 and 12.1.0.5.0 are only supported with the following versions of the database:
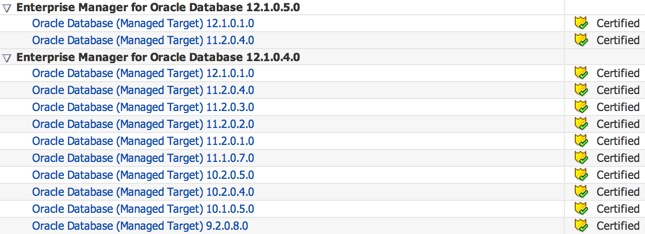
I wrote a post on an Alternative Method to monitor GoldenGate from EM12c outside the GoldenGate 12.1.0.1.0 Plugin which is another good example.
What about the less-supported OS versions which fall in between? I had an unfortunate experience with a client post successful agent deployment where the console showed no explanation as to why the database targets (10.2.0.2, 10.2.0.3, 11.1.0.6 etc) remained in a “Status Pending” state. After an SR and many hours of wrestling with this issue, I was informed that the the particular releases were unsupported in EM12c due to inherent bugs within the databases’ alerting mechanism. The realization that the EM12c OMS spending time and resources (job queue processes) on a target in a “Status Pending” state would result in a waste resources and reduced allocation to monitor critical systems was valuable information. Even more valuable for any administrator who may first assume that a "Status Pending" target is a benign issue to address on a slow day. C’est la vie.
Moving right along, I knew there was a way to configure basic (Tablespace Usage and Database Status) monitoring for these poor databases and Metric Extensions were my solution. Please note, this solution worked only because the OS versions were supported for the agents. To summarize the illustration below, the extensions will be deployed onto the host target where the unsupported Oracle database version instances reside - along with support versions. This also means, that the new metric will at the host level because the unsupported database targets should not exist in the EM12c repository.
In this post, I’d like you show you how to setup a Tablespace Usage ME in EM12c. With a subsequent post, I will go over the Database Status check.
You might be wondering if there is more than one unsupported database version and the metric extension will be created on the host layer, then what would the data look like? Would it be one output with all databases, or different outputs for each respective database? Well, I gave that a lot of thought, and at the end of the day, what made me decide was “How will the metric be used?”. I needed alert notifications, so for that purpose a single output would suffice.
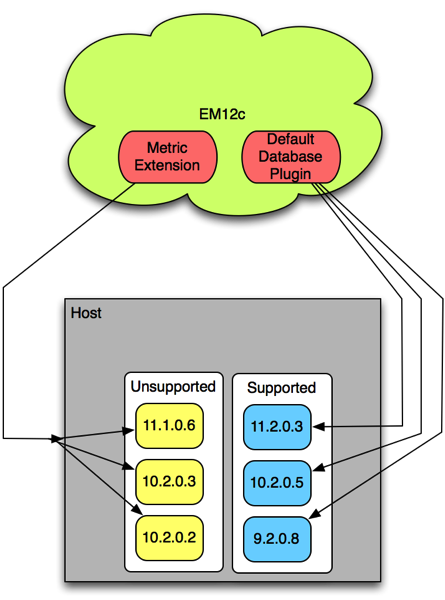
The basic lifecycle of a Metric Extension is illustrated on its Home Page in EM12c. Quite simply put, you develop, test, and eventually deploy the extension once ready. I’ll go through all of these steps for our unsupported versions towards the end the blog.

Let’s get started.
1. Before we can even begin with creating a Metric Extension, we need to design our “check”. In my case, it’s a simple query which is executed via shell script that loops through the /etc/oratab entries, and a) checks the status of the instance listed, b) if found active, then c) executes a SQL statement to collect the tablespace usage information. When I initially wrote this script, the host where I intended to run the ME only had unsupported versions of the Oracle Database running, therefore checking all instances in /etc/oratab made sense. If you have an environment where both types of databases (supported vs unsupported) reside, then perhaps a simple text file with the instances names, or make the script smarter to check for only unsupported releases (hard coded) from the oratab. I would appreciate any feedback with better suggestions!
The output for the above query would look similar to what you see below. Pay close attention to the order of the columns, this will be important later.
oracle on greed101 -# sh host_database_unsupported_version_tablespace.sh
RED|AIMTRANS|2200|1001|1199|45.51
RED|AKB_DATA|3247|1179|2068|36.3
RED|AUDIT_SUPPORT_TS|50|0|50|.25
RED|DGDATA1|700|272|428|38.87
RED|DGINDEX1|30|16|14|52.71
RED|SYSTEM|800|662|138|82.81
BLUE|EUL_DATA|100|16|84|16.5
BLUE|FACT1|600|329|271|54.85
BLUE|FACT2|226960|204288|22672|90.01
BLUE|INDEX1|300|179|121|59.75
BLUE|INDEX2|131616|118199|13417|89.81
BLUE|SYSTEM|800|662|138|82.81
GREEN|STRUCTURE1|1000|334|666|33.42
GREEN|SYSTEM|800|662|138|82.81
GREEN|WORK1|1052708|1001089|51619|95.1
GREEN|AUDIT_SUPPORT_TS|500|0|500|.01
BLACK|IVIS|500|235|265|46.94
BLACK|SYSTEM|300|189|111|63.12
BLACK|DATA_FEEDER_DATA|1200|733|467|61.06
BLACK|DGADATA1|8192|2312|5880|28.23
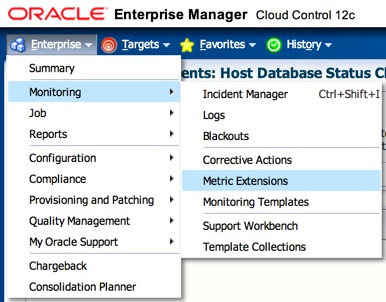
1. Navigate to the Metric Extensions home page in Enterprise Manager.
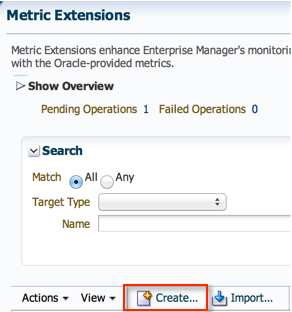
2. Click on Create.
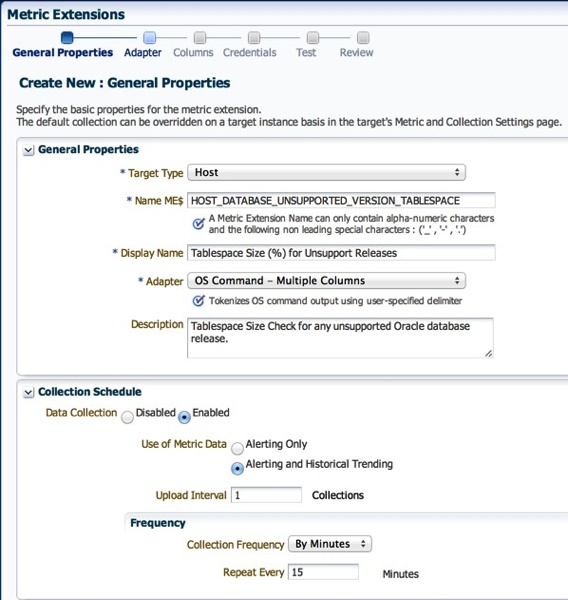
3. Give the new Metric a name, display name, and a description. In Target Type, I left the default as “Host”. In Collection Schedule, I left the defaults as well. Click “Next”.
4. On the next screen, in the “Command” field, enter “sh” since we’ll be uploading a shell script. For the actual script, we need to click on the “Edit” pencil icon. Here, we can enter the file name and paste the actual script from above. The “Delimiter” field is quite important, because it is how the Metric Extension framework will differentiate the data between columns. Click “OK”.
Note 1: Alternatively, you could also upload the file if already saved on your local machine.
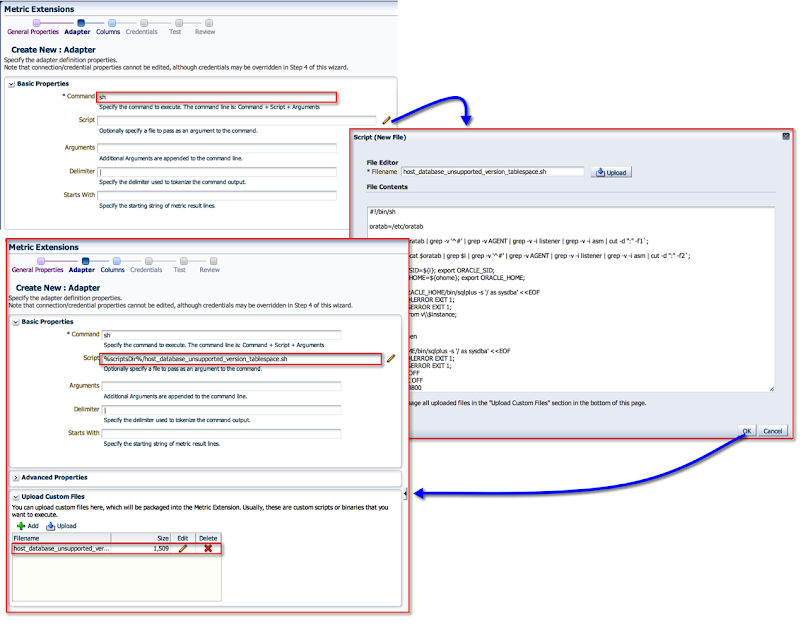
Note 2: You have to love the documentation provided towards the right half on this screen. The explanation is quite enough and interface is intuitive enough for you to figure out how to upload.
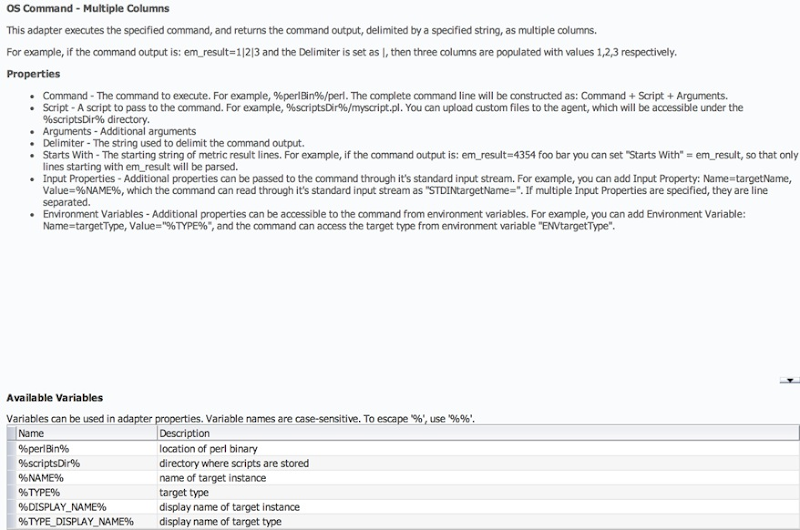
5. On the next screen, we will add columns to our metric. Do you recall the columns in the script from earlier? We need to now add them in the same order, i.e. Database Name, Tablespace Name, Total Space MB, Used Space MB, Free Space MB, and Used Space Percent.
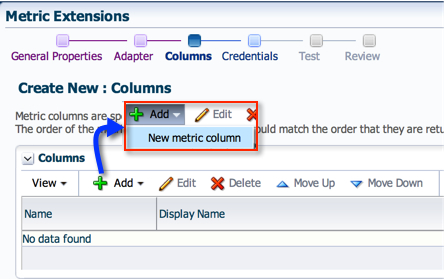
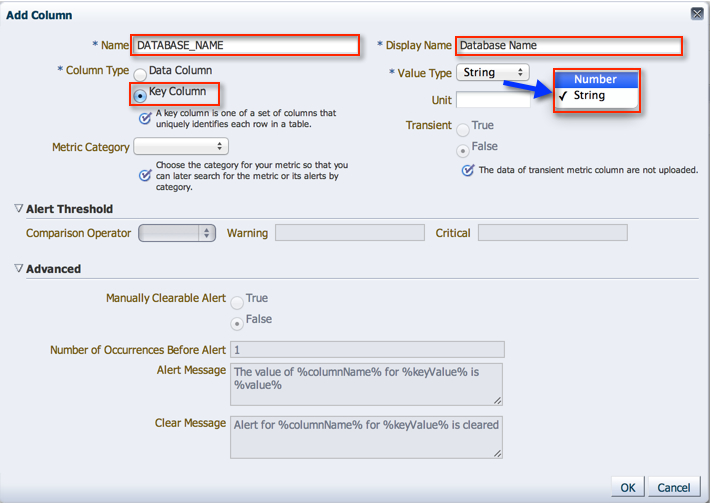
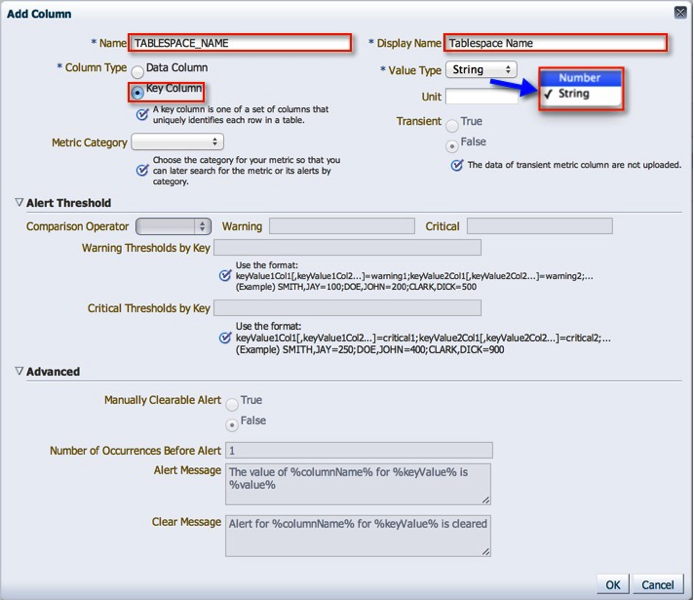
5.1. The first is Database Name. A Metric Extension requires that at least one column contain unique values in the result set. For our result set, we will use the combination of Database Name, and Tablespace Name.
You must select the “Column Type” as “Key Column” and “Value Type" as “String”.
5.2. Tablespace Name, as mentioned earlier, is also a Key Column.
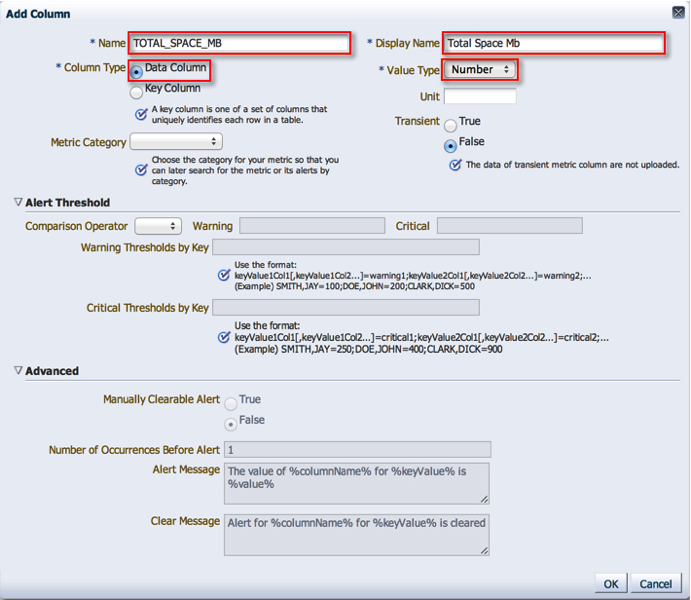
5.3. Total Space MB. Please note that I left the “Column Type” and "Value Type" as defaults.
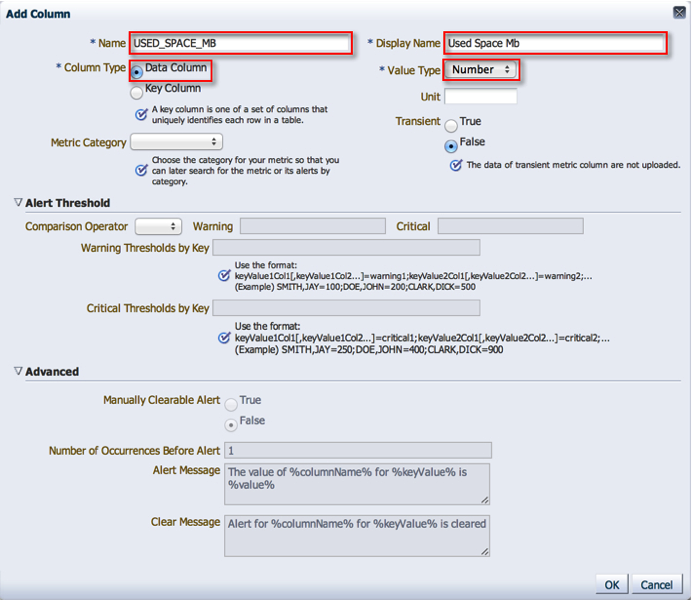
5.4. Used Space MB. Please note that I left the “Column Type” and "Value Type" as defaults.
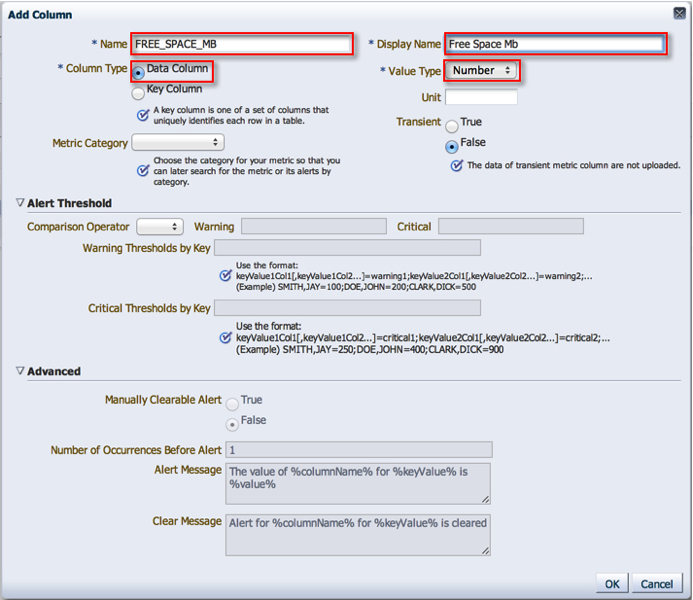
5.5. Free Space MB. Please note that I left the “Column Type” and "Value Type" as defaults.
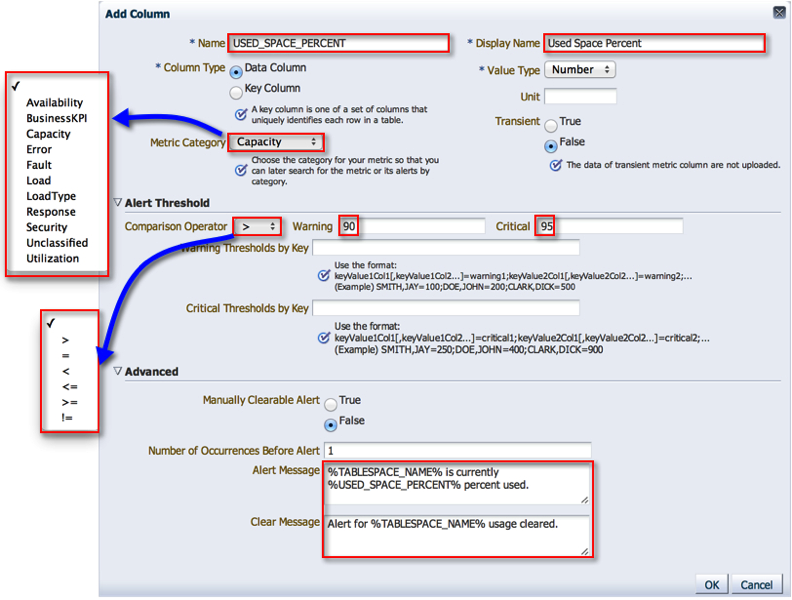
5.6. Now, for the last and most important column. Used Space Percent.
Under “Metric Category” I selected “Capacity”. This setting doesn’t have an actual impact, but for reporting purposes is useful.
Since my ultimate goal was alerting for creating this metric, I picked the “Greater Than (>)” “Comparison Operator” and added Warning/Critical thresholds.
You can actually customize the alert message from this section using the columns added. I chose the message below, but please feel free to customize it to your desire.
Once all the information is entered, please click “OK” and then “Next”.
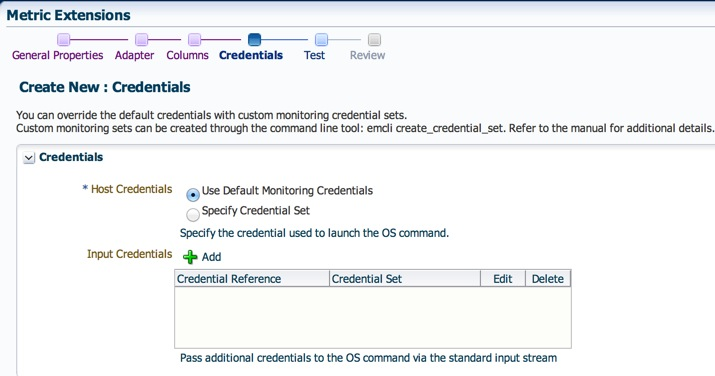
6. Use the default monitoring credential set.
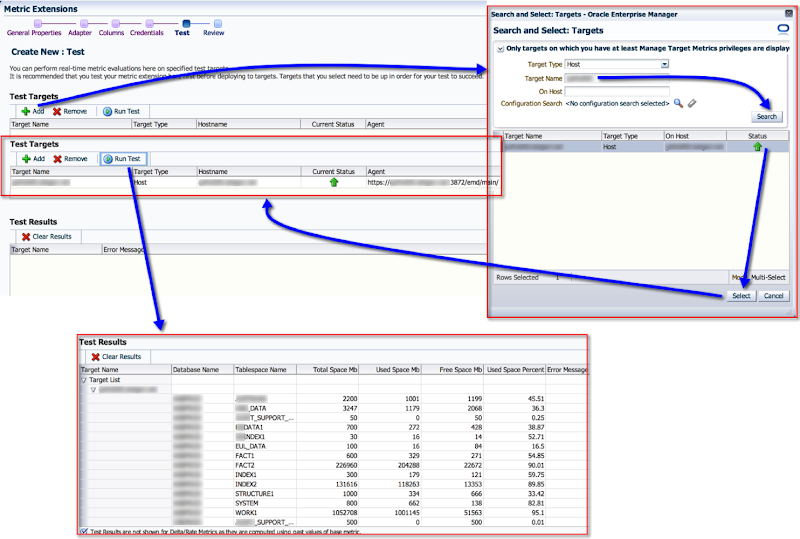
7. Here we actually get to test out the script a host. Follow the screen shots below to run a test. Once test successfully, click “Next”.
8. Review your settings and click “Finish”.

Succes!

Remember this from earlier?

We have gone through the Development phase, and are ready to save this metric extension as a Deployable Draft.
9. On the Metric Extensions home page, select the extension we created -> Actions -> Save as Deployable Draft.

It’s status will now change to “Deployable Draft”
![]()
10. At this point, we have two options
a) Keep the metric extension in “Deployable Draft” status, and deploy directly onto a host target, or
b) Publish it, where it can be used by other modules within the EM12c infrastructure, i.e. my personal favorite, Monitoring Templates.
The latter allows us to have a more reliable and repeatable process by using Monitoring Templates. Its your lucky day, because I will show you how to do both.
10.1. Deploying a “Deployable Draft” Metric Extension to a target.
10.1.1. From the Metric Extension Home page, select the metric -> Actions -> Deploy to Target.
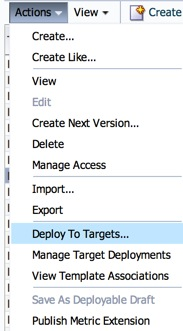
10.1.2. Add a target where you’d like to deploy the ME. Click “Submit” when done.
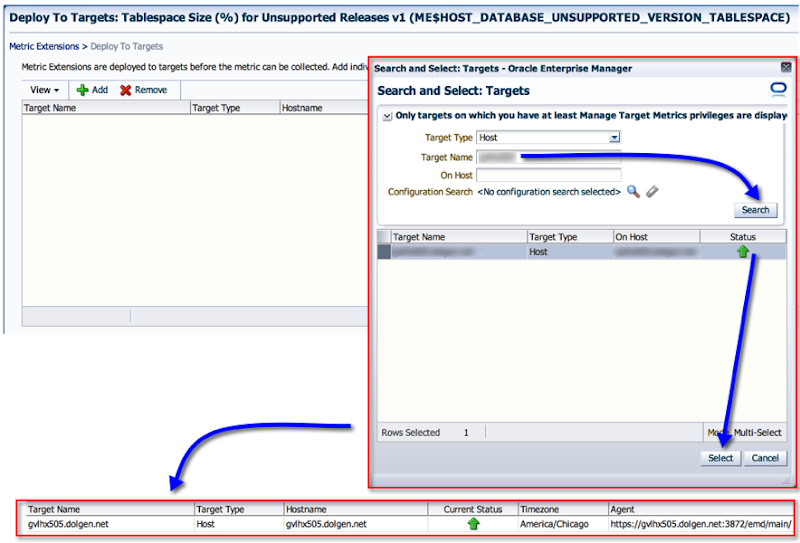
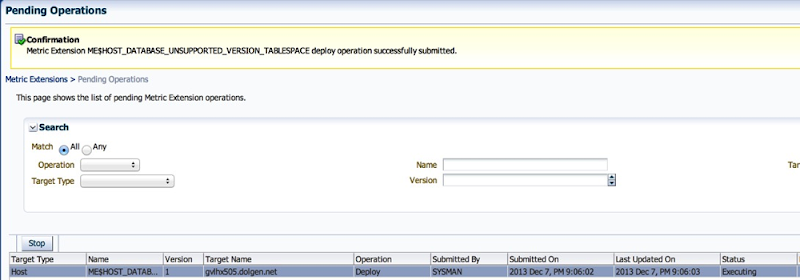
10.1.2. The next screen shows any pending operations. Waits a few seconds and hit ![]() refresh on the top right.
refresh on the top right.
10.1.3. Back on the ME home page, we can actually see the # of targets the ME has been deployed onto.

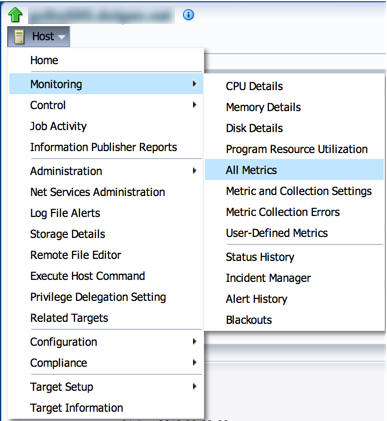
10.1.4. At this point, we can simply check on the Hosts “All Metrics” screen.
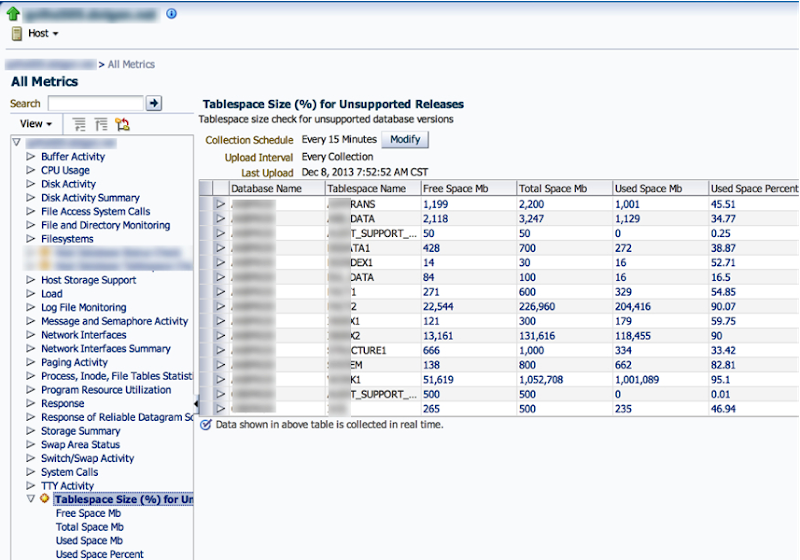
10.1.5. And presto, the metric and its data are collecting!
10.2. Deploying a Metric Extension to a Monitoring Template.

10.2.1. We need to ensure that the ME is in a “Published” state. To do that, select it from the ME home page -> Actions -> “Publish Metric Extension”
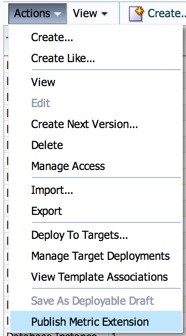

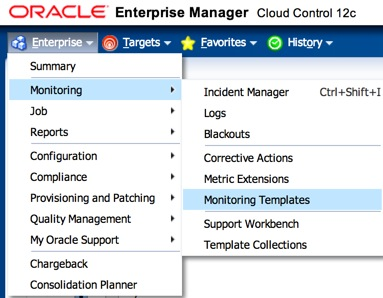
10.2.2. Now, make your way to the Monitoring Templates home page and either create a new one, or edit an existing one. The point here is to add metrics to the template.
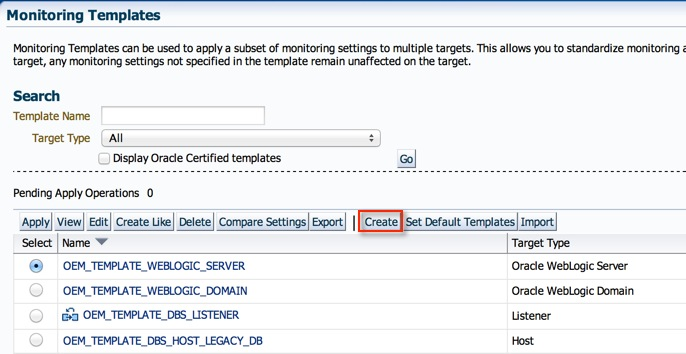
10.2.3. On the Templates home page, click on “Create”.
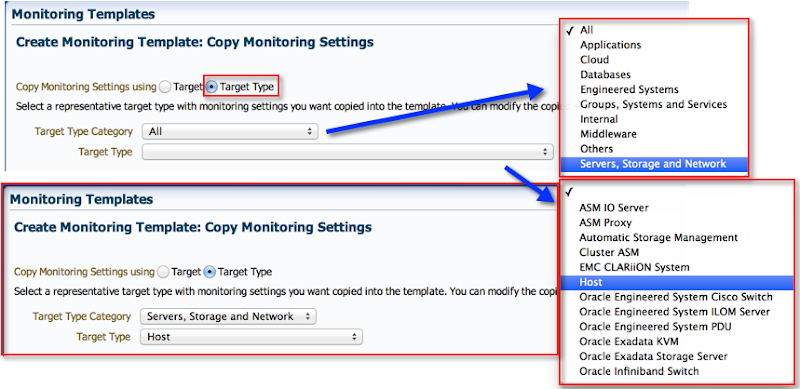
10.2.4. On the next screen, select “Target Type” as the copy monitoring settings from option. Pick “Servers, Storage and Network” from the category, then “Host” from the Target Type.
You would alternatively, pick an existing host as the copy monitoring settings from, either way it doesn’t matter for our purpose. The template I create will only contain one metric.
10.2.5. Enter an appropriate name for the template, and a description. Then, click on the “Metric Thresholds” tab.
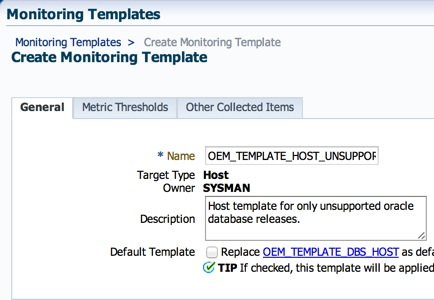
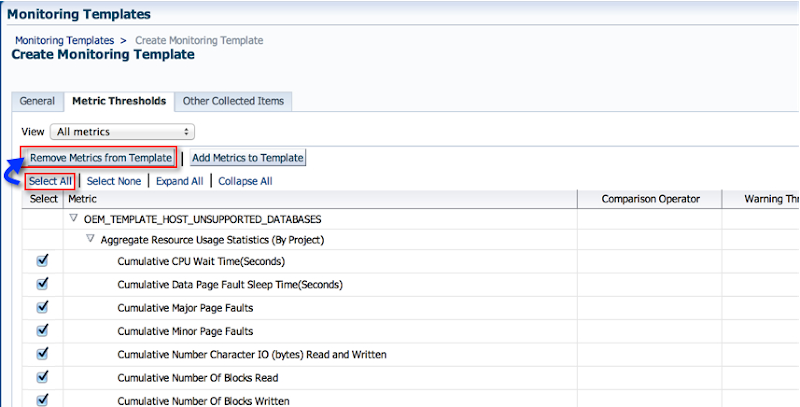
10.2.6. As I mentioned earlier, my goal is to create a template with only one metric. Therefore, I need to remove all the others. Click on the “Select All” button and then “Remove Metrics from Template”.
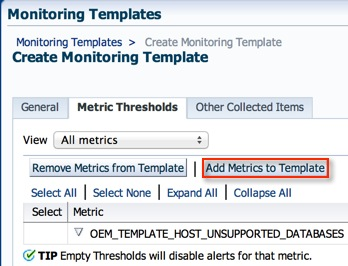
10.2.7. Click on “Add Metrics to Template”.
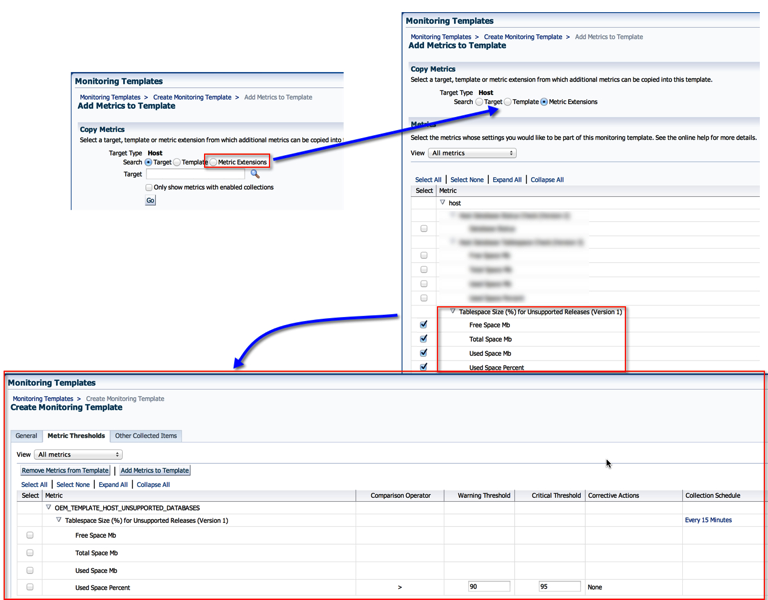
10.2.8. Select “Metric Extensions” in the search, and the results will show the ME created earlier. Select all columns from it and click “Continue” and “OK”.
Note: Change the thresholds if they need to be different in the template.
10.2.9. Next, we apply the template to a target. Select the template, and click on Apply. Add the targets you want to apply this template to and click “OK”.
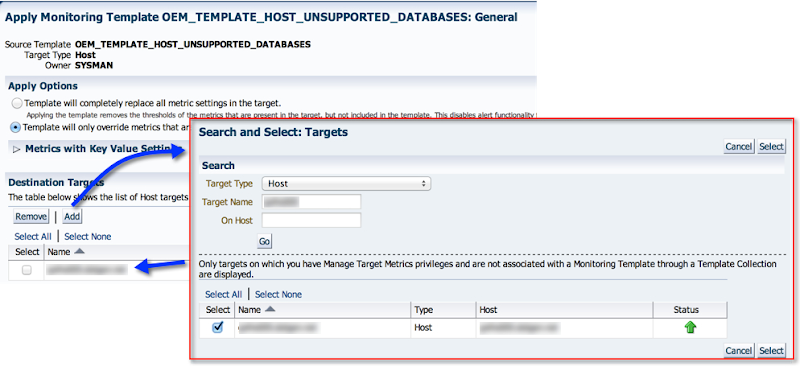
10.2.10. Once applied, we can proceed to the hosts’ “All Metrics” page (Step 10.1.4.). And presto!

Now that we have the ME collecting data, you can create Incident Rules to catch the offending tablespaces. I won’t go into that with this post, but Kellyn Pot’vin has several awesome posts on Incident Management to address that aspect.
If you are still with me, I want urge you to let your imagination go wild with what all can be collected and monitored by leveraging EM12c’s Metric Extensions feature. Metrics from non-oracle databases, application specific information, and so on and so forth.
Cheers!